Open Access
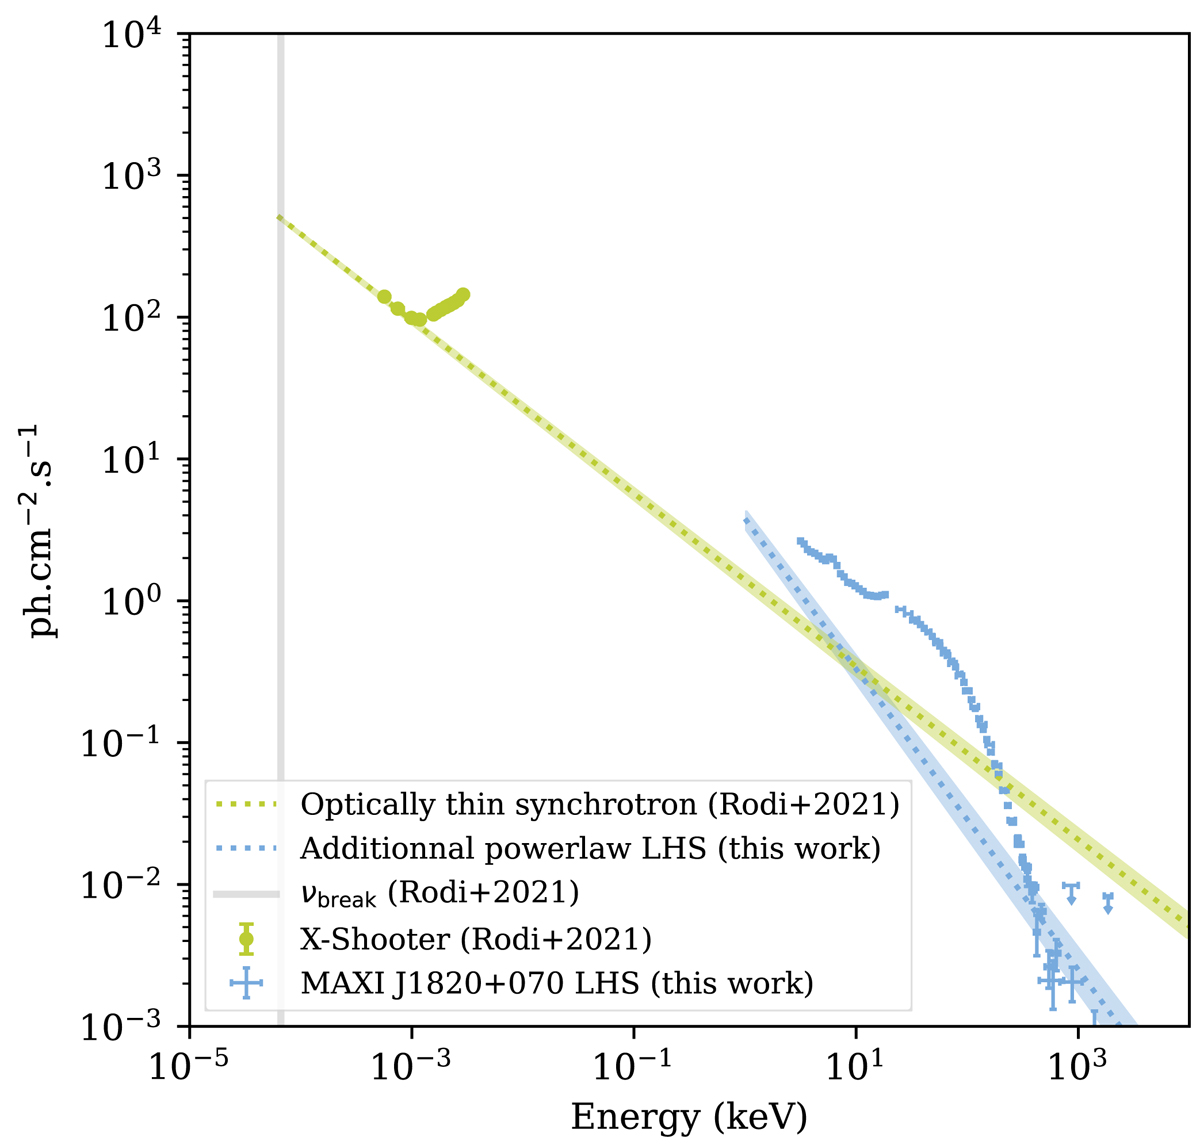
Fig. 8.
Download original image
MAXI J1820+070 spectrum using observational data from Rodi et al. (2021) and this work. The measured additional high-energy component is indicated by the blue dotted line. The green dotted line is the extrapolation of the optically thin synchrotron spectrum from Rodi et al. (2021).
Current usage metrics show cumulative count of Article Views (full-text article views including HTML views, PDF and ePub downloads, according to the available data) and Abstracts Views on Vision4Press platform.
Data correspond to usage on the plateform after 2015. The current usage metrics is available 48-96 hours after online publication and is updated daily on week days.
Initial download of the metrics may take a while.