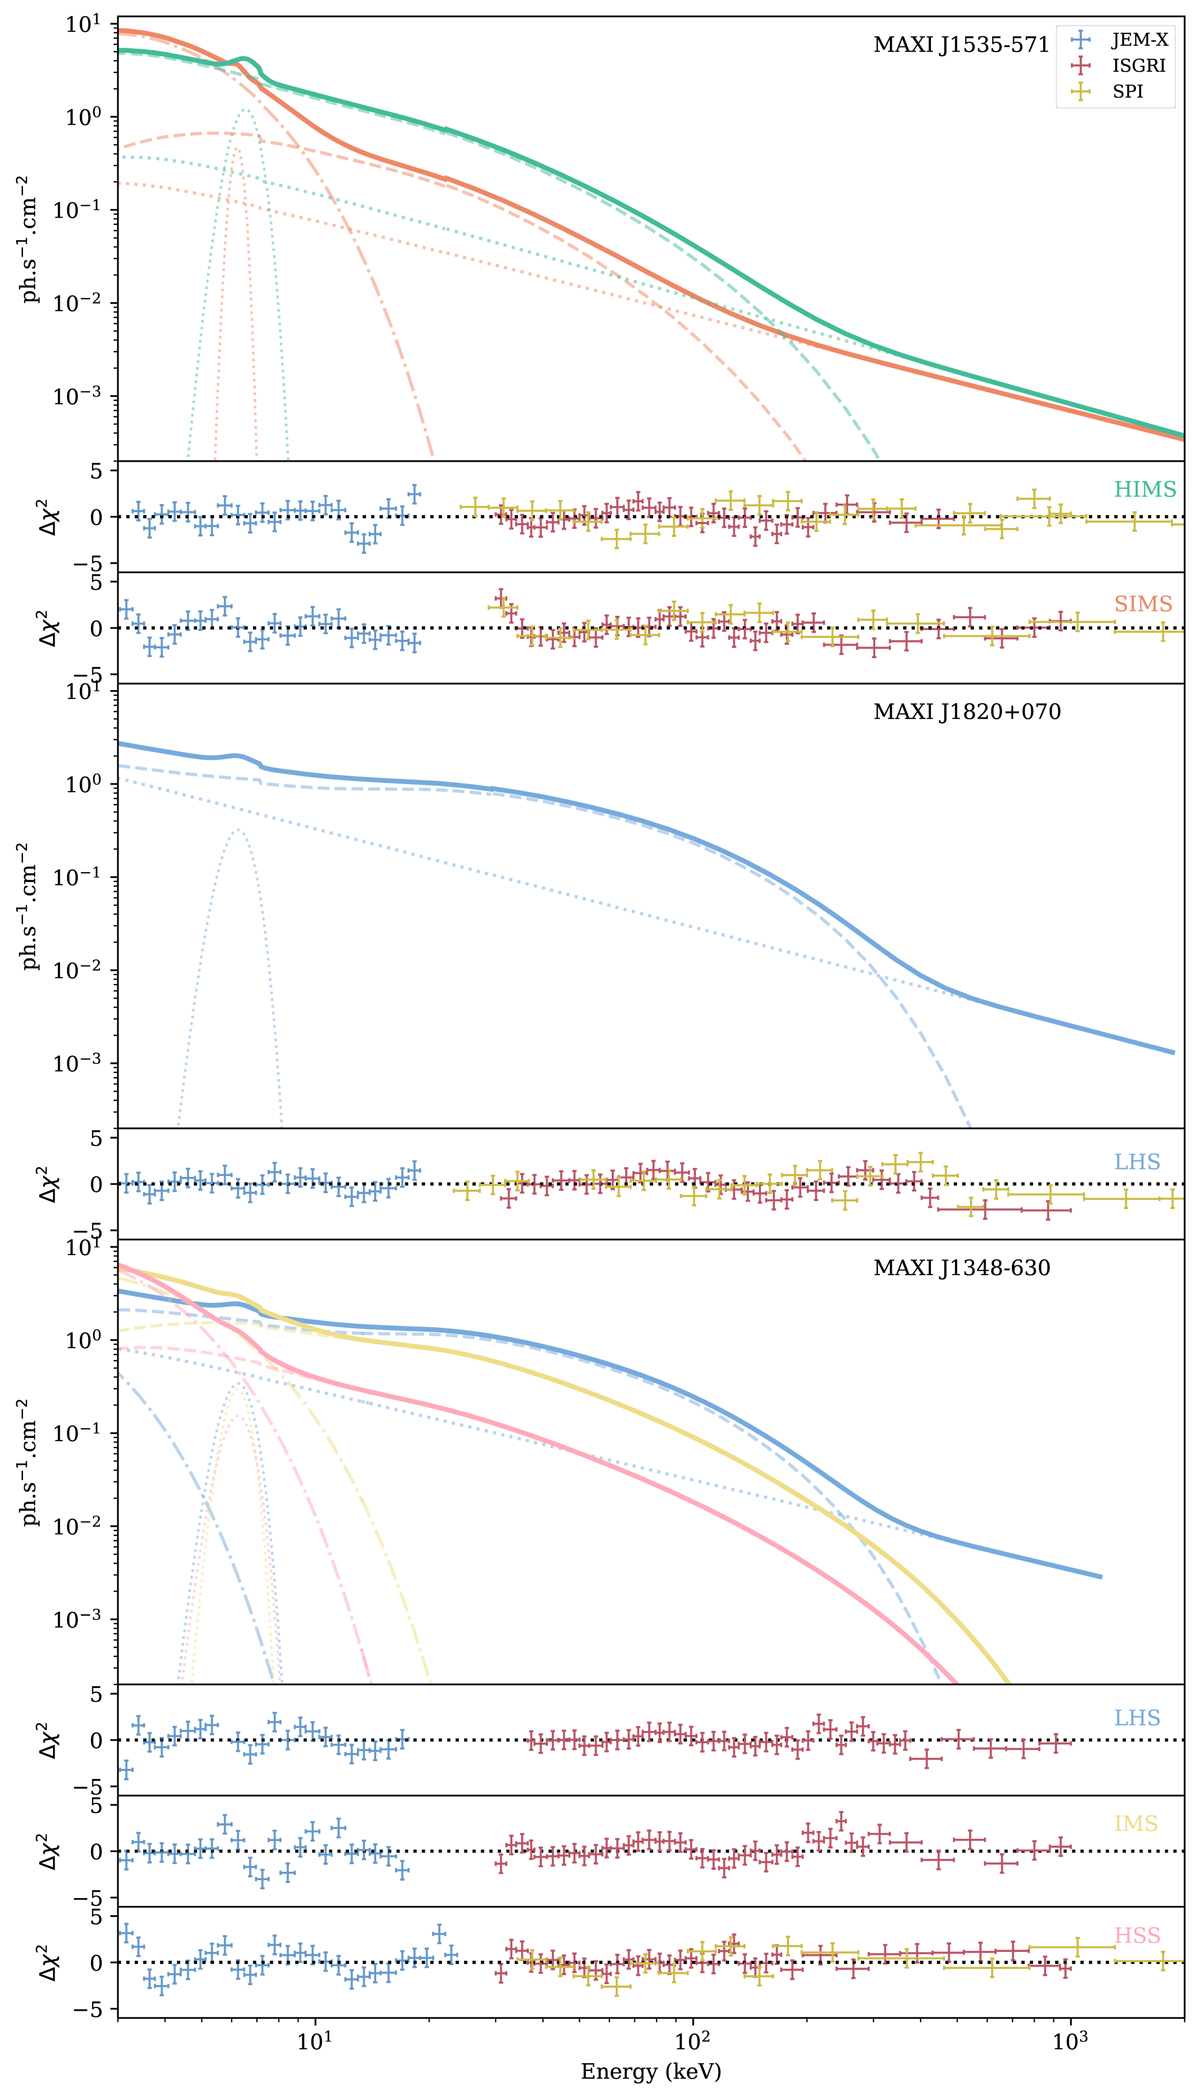
Fig. 4.
Download original image
Best-fit models obtained from our phenomenological fittings of the 3–2000 keV for MAXI J1535 − 571 (top panel), MAXI J1820+070 (middle panel), and MAXI J1348 − 630 (bottom panel). Different colors indicate different epochs using the same color code as in Fig. 1. JEM-X, ISGRI, and SPI data are represented in blue, red, and yellow, respectively. Residuals for each period are plotted separately at the bottom of the corresponding spectrum. Different model components are shown with different line styles: Comptonized continuum (dashed), disk (dotted-dashed), additional power law (densely dotted), gaussian (dotted).
Current usage metrics show cumulative count of Article Views (full-text article views including HTML views, PDF and ePub downloads, according to the available data) and Abstracts Views on Vision4Press platform.
Data correspond to usage on the plateform after 2015. The current usage metrics is available 48-96 hours after online publication and is updated daily on week days.
Initial download of the metrics may take a while.