Open Access
Fig. 2.
Download original image
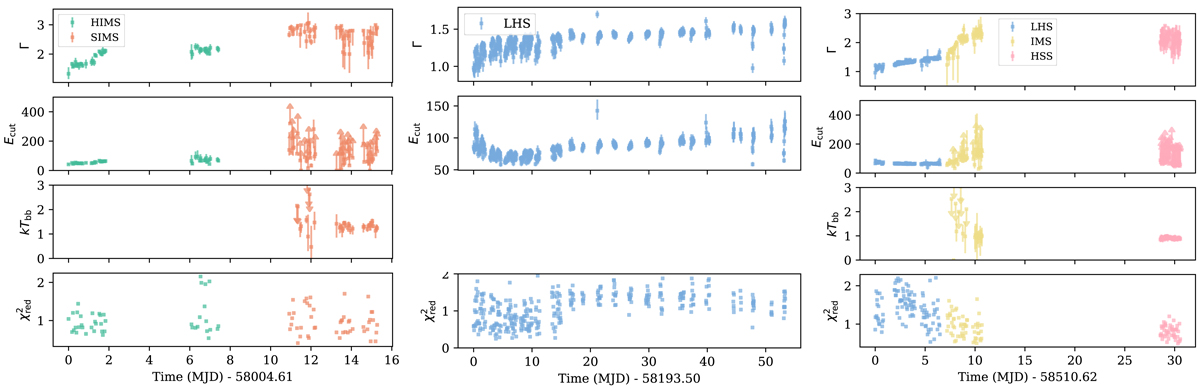
Temporal evolution of the different spectral parameters extracted from our phenomenological spectral fitting for MAXI J1535 − 571 (left panel), MAXI J1820+070 (middle panel), and MAXI J1348 − 630 (right panel). Definitions of the different periods and their corresponding colors are described in Sect. 2.4.
Current usage metrics show cumulative count of Article Views (full-text article views including HTML views, PDF and ePub downloads, according to the available data) and Abstracts Views on Vision4Press platform.
Data correspond to usage on the plateform after 2015. The current usage metrics is available 48-96 hours after online publication and is updated daily on week days.
Initial download of the metrics may take a while.