Fig. 1.
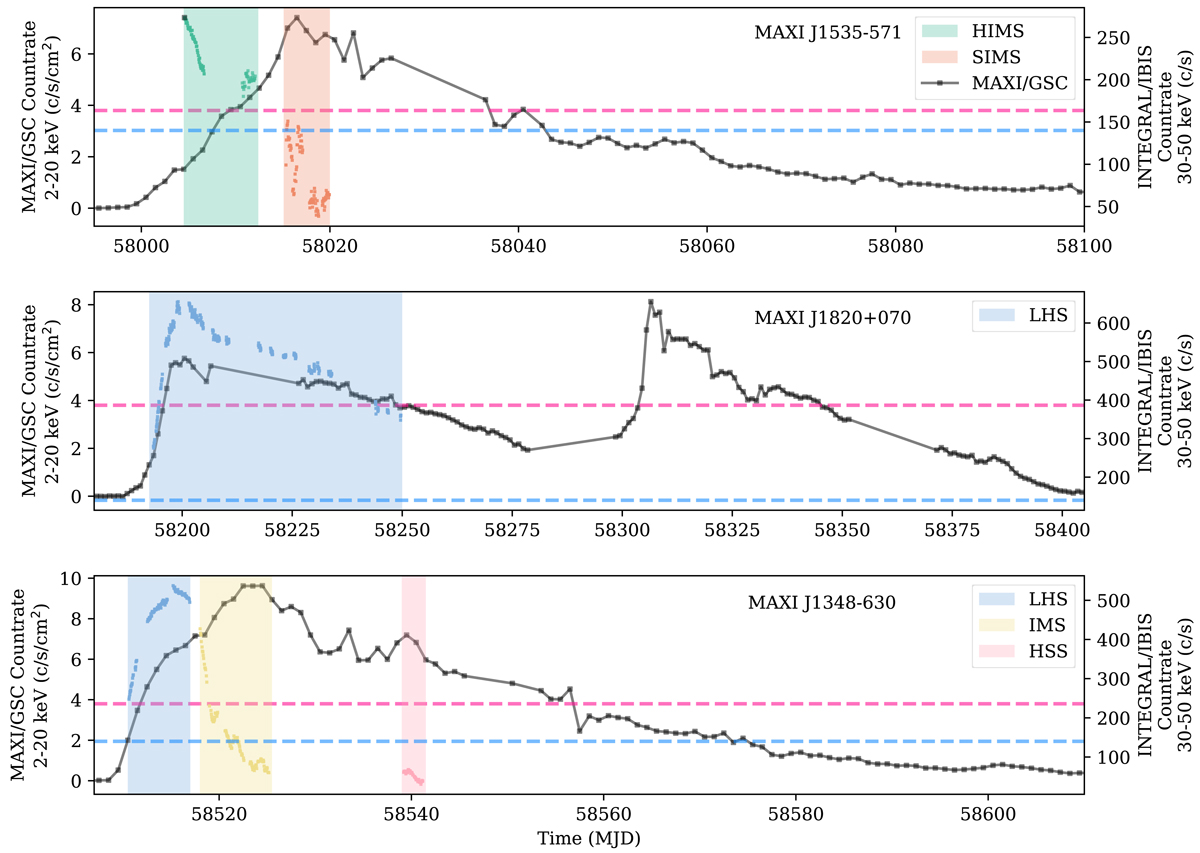
Download original image
MAXI/GSC 2–20 keV (in black) and INTEGRAL/IBIS 30–50 keV (colored dots) light curves of MAXI J1535 − 571 (top panel), MAXI J1820+070 (middle panel), and MAXI J1348 − 630 (bottom panel). The left and the right y-axes indicate the count rate for MAXI/GSC and INTEGRAL/IBIS, respectively. Definitions of the different periods and the corresponding colors are described in Sect. 2.4. The count rates for 1 Crab are indicated with the pink and blue dotted lines for MAXI/GSC and INTEGRAL/IBIS, respectively.
Current usage metrics show cumulative count of Article Views (full-text article views including HTML views, PDF and ePub downloads, according to the available data) and Abstracts Views on Vision4Press platform.
Data correspond to usage on the plateform after 2015. The current usage metrics is available 48-96 hours after online publication and is updated daily on week days.
Initial download of the metrics may take a while.