Fig. 8
Download original image
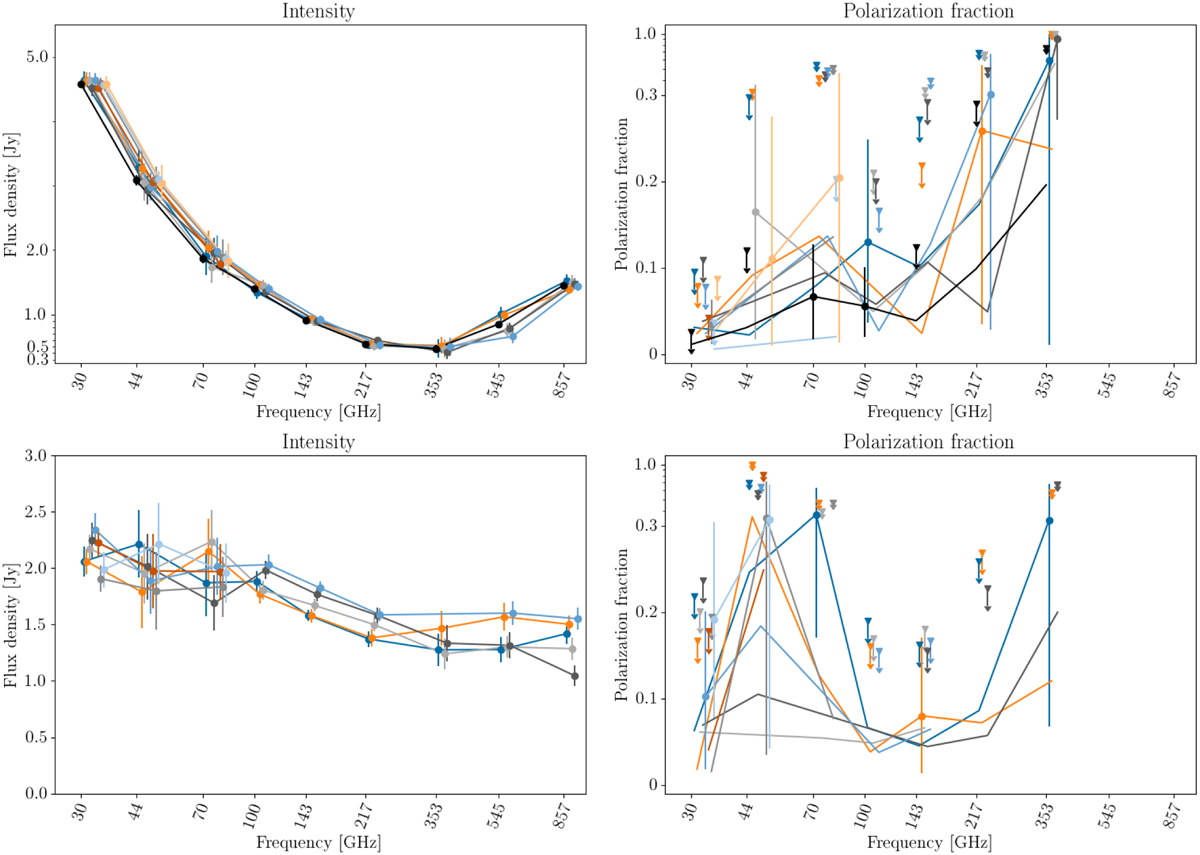
Same as in Fig. 7, but the lines and points of different colors mark different observing epochs, separated by 6 months. For the polarization fraction (right column) we plot the maximum likelihood value as a solid line and indicate a 68% confidence region or 95% upper limit with error bars. Top: An AGN (3C 353) displaying no significant changes in SED, and small, but apparently constant polarization. Bottom: a BL Lac object, PKS 1514–24, showing only mild variability, and no significant change in polarization.
Current usage metrics show cumulative count of Article Views (full-text article views including HTML views, PDF and ePub downloads, according to the available data) and Abstracts Views on Vision4Press platform.
Data correspond to usage on the plateform after 2015. The current usage metrics is available 48-96 hours after online publication and is updated daily on week days.
Initial download of the metrics may take a while.