Fig. 6
Download original image
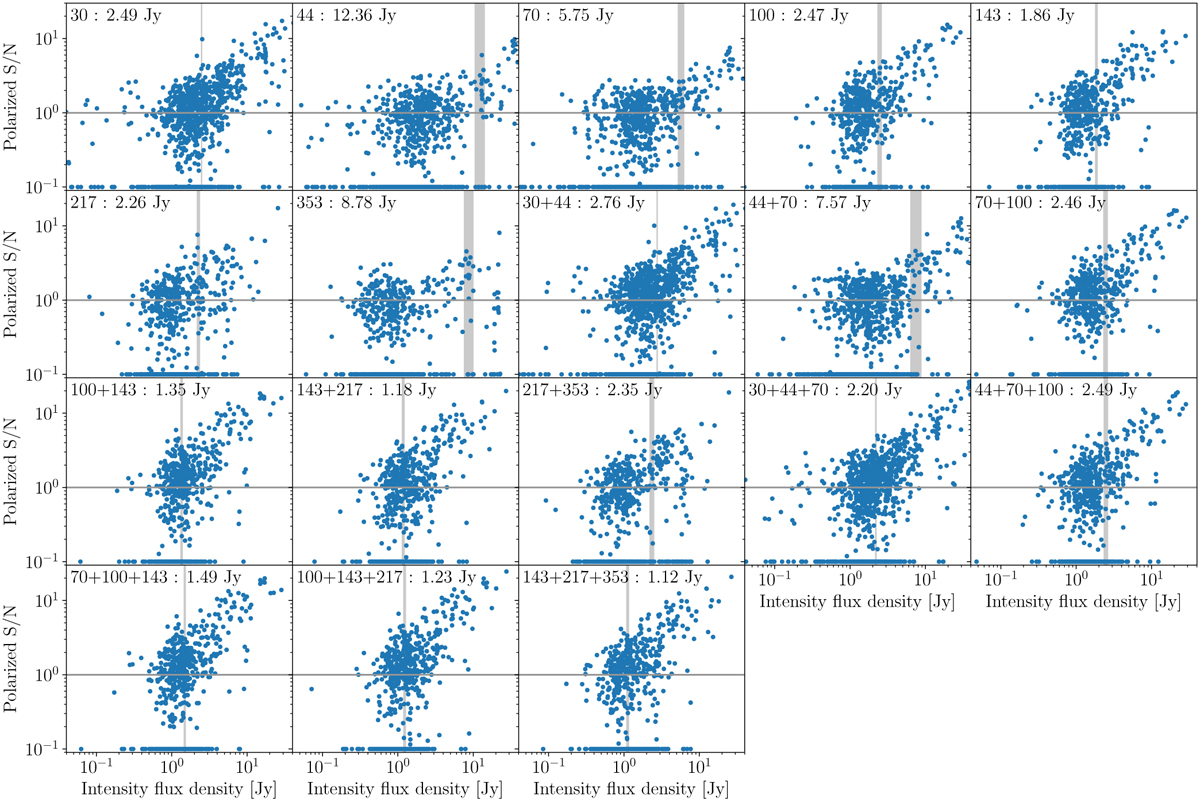
Polarized S/N: for each polarization-sensitive observation in our catalog, we plot the de-biased polarized flux density S/N against the intensity flux density. Observing bands are indicated in the labels. For cases where de-biasing renders a S/N less than 0.1, we plot a data point at 0.1. The vertical grey bands indicate the lowest and narrowest flux density bin that has a median S/N of 1.0 and at least 20 entries. The center of the bin is spelled out in the label.
Current usage metrics show cumulative count of Article Views (full-text article views including HTML views, PDF and ePub downloads, according to the available data) and Abstracts Views on Vision4Press platform.
Data correspond to usage on the plateform after 2015. The current usage metrics is available 48-96 hours after online publication and is updated daily on week days.
Initial download of the metrics may take a while.