Fig. 4
Download original image
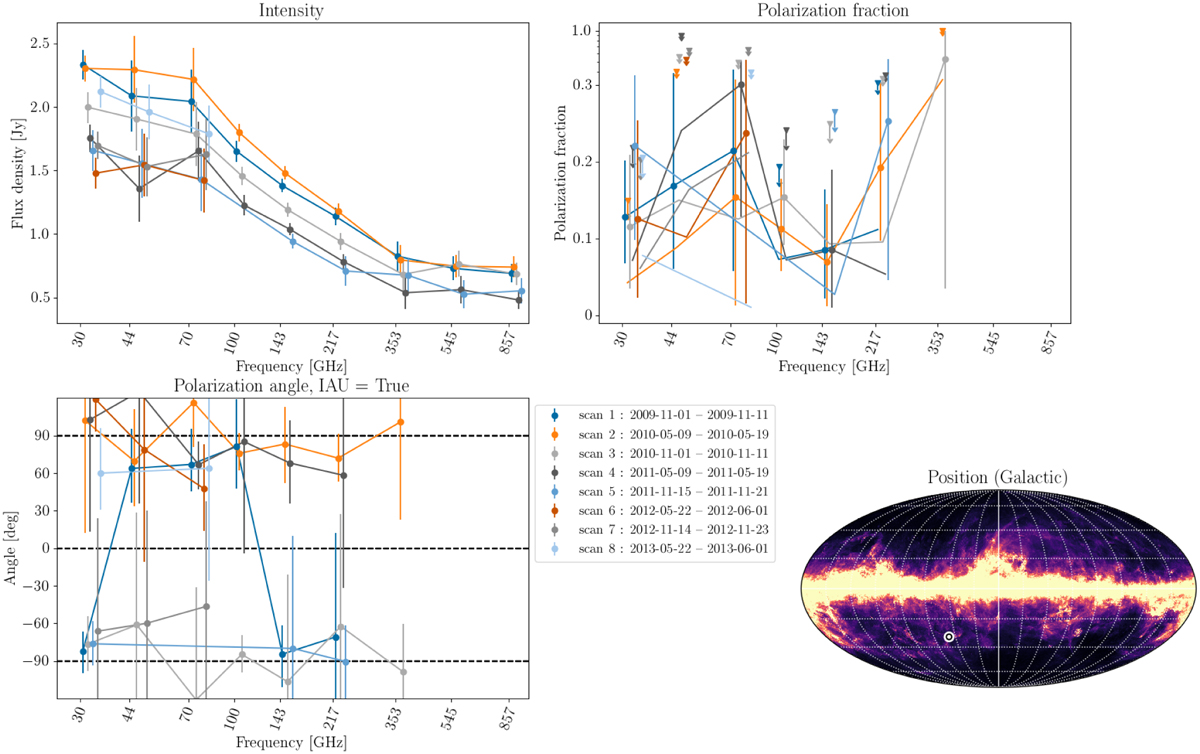
Example of a full diagnostic plot showing intensity, polarization fraction, polarization angle, and position for PCCS2 143 G052.40–36.49. The polarization fraction axis is nonlinear between 0.3 and 1.0 to accommodate all values. The lines and points of different colours mark different observing epochs, separated by 6 months. The Galactic-coordinate map (HEALPix formatted, Górski et al. 2005) in the lower right panel shows the position of the source on top of the Planck 857 GHz intensity map. Plots and maps similar to this are provided for each source and each number of jointly fit frequencies.
Current usage metrics show cumulative count of Article Views (full-text article views including HTML views, PDF and ePub downloads, according to the available data) and Abstracts Views on Vision4Press platform.
Data correspond to usage on the plateform after 2015. The current usage metrics is available 48-96 hours after online publication and is updated daily on week days.
Initial download of the metrics may take a while.