Fig. 3
Download original image
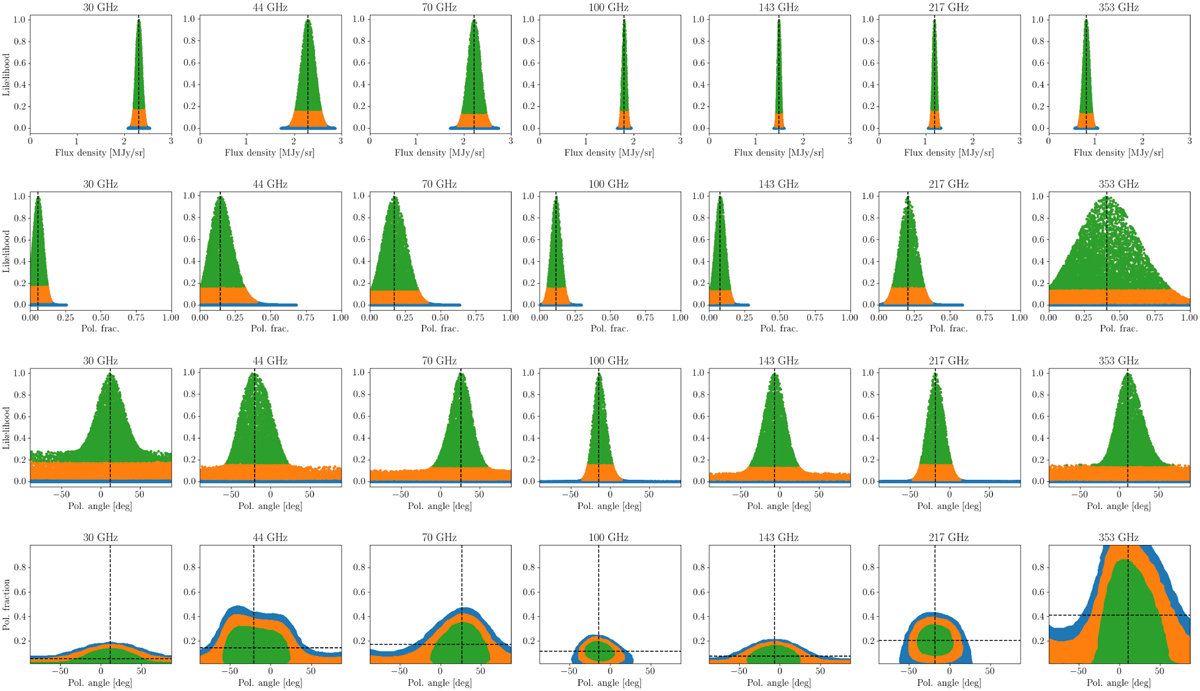
100 000 sampled values of the likelihood function, projected to the intensity axis (top row), polarization fraction axis (second row) or polarization angle axis (third row). The source, PCCS2 143 G052.40–36.49 also known as 4C–02.81, was chosen because it has both positive detections of and upper limits on polarization fraction. The likelihood threshold that includes 68% of the total likelihood is indicated in green and 95% in orange. Samples with likelihood lower than 95% of the distribution are in blue. When the green part of the polarization fraction distribution excludes zero, we report a 68% confidence interval. When zero is included, we report a 95% upper limit. The bottom row presents the maximum of the likelihood function in the polarization fraction-polarization angle plane. The dashed lines indicate the maximum likelihood values. The likelihoods are based on the first survey shown in Fig. 4.
Current usage metrics show cumulative count of Article Views (full-text article views including HTML views, PDF and ePub downloads, according to the available data) and Abstracts Views on Vision4Press platform.
Data correspond to usage on the plateform after 2015. The current usage metrics is available 48-96 hours after online publication and is updated daily on week days.
Initial download of the metrics may take a while.