Free Access
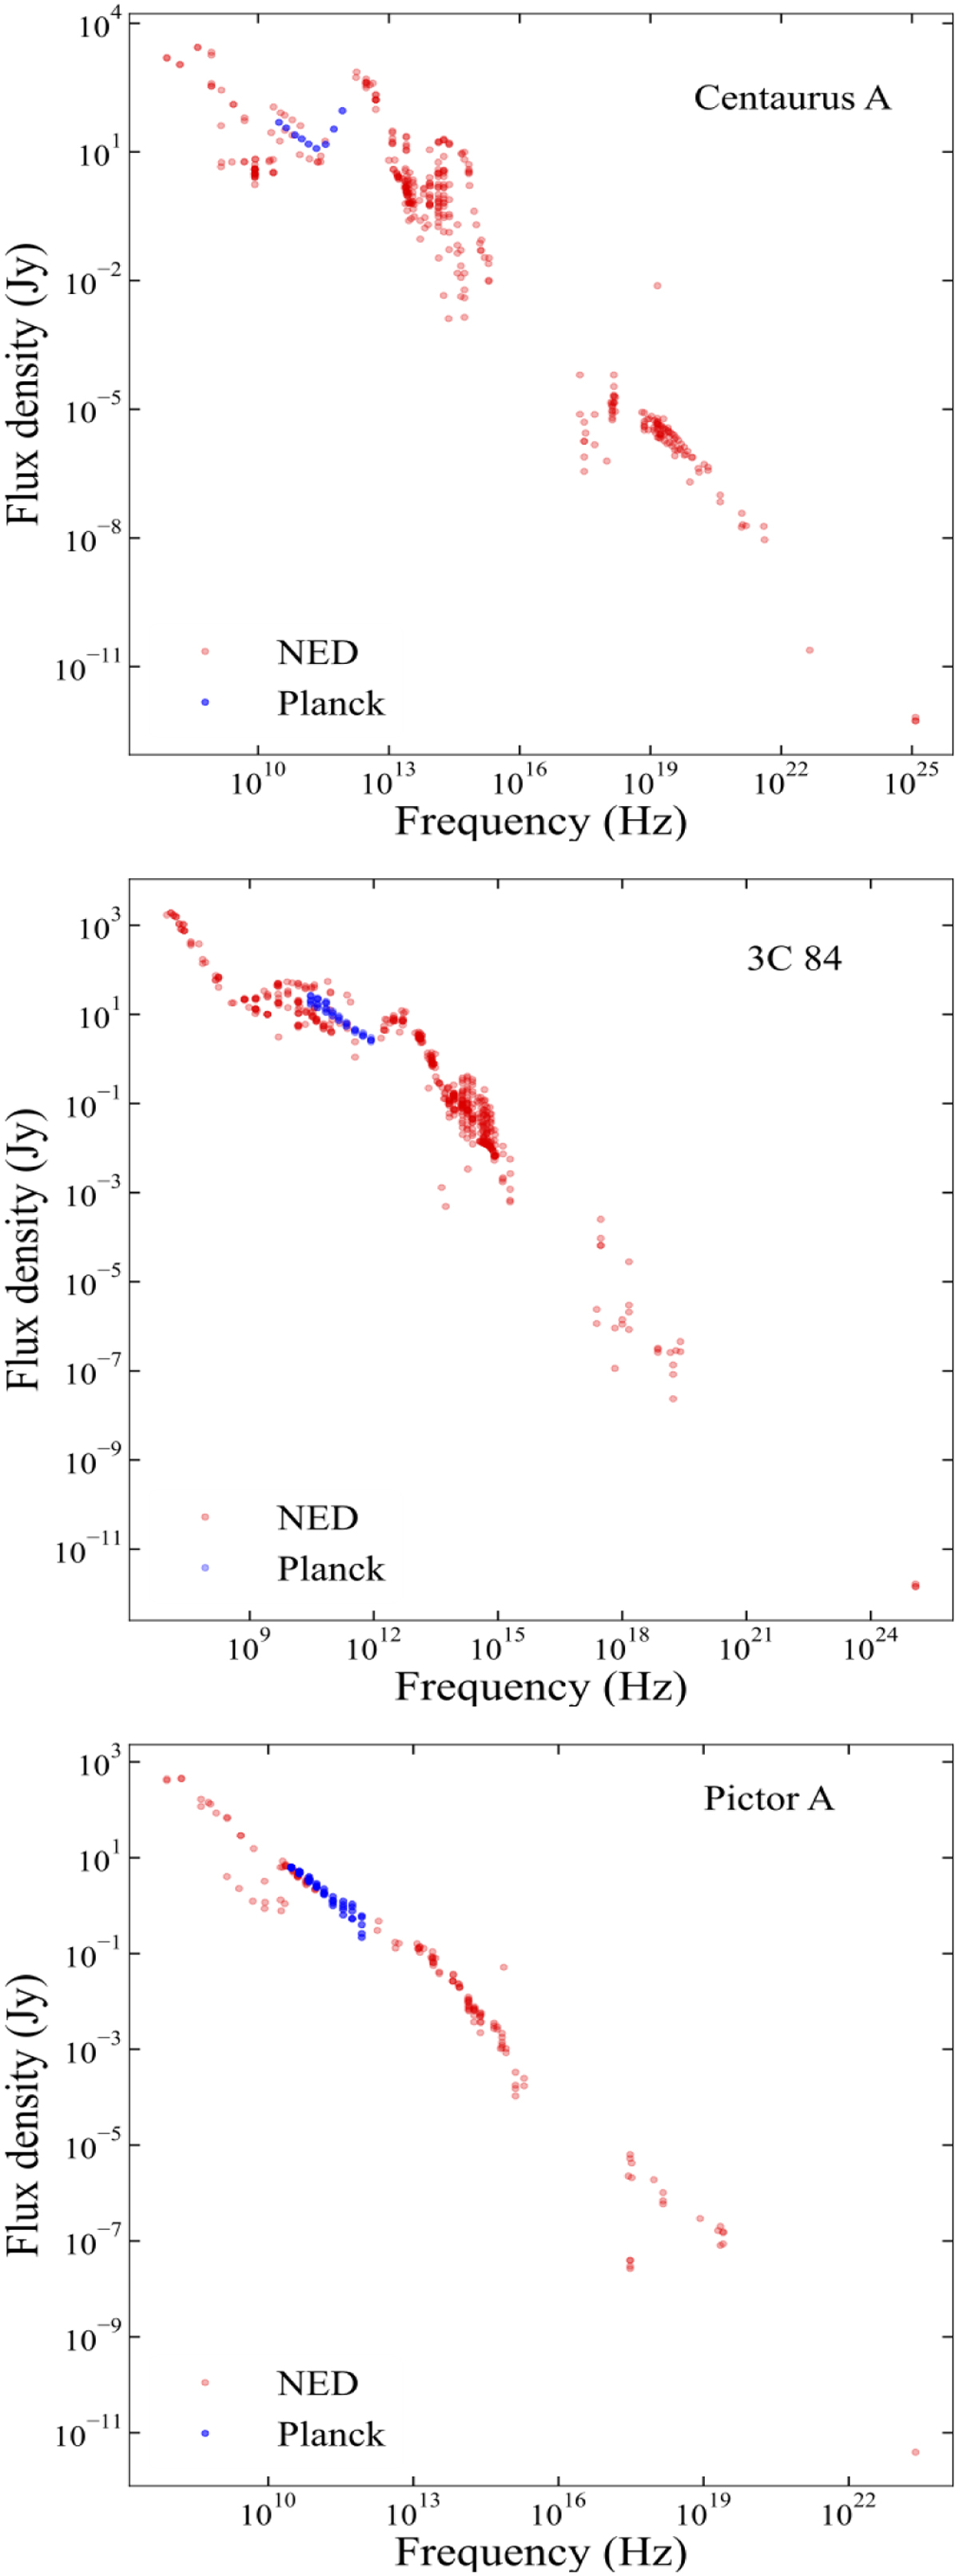
Fig. 15
Download original image
Spectral energy distribution (SED) for a few sources: red points are photometry from NED and the blue points are our Planck observations. The Planck data for Cen A add some new spectral coverage and help to define the rise of the dust component.
Current usage metrics show cumulative count of Article Views (full-text article views including HTML views, PDF and ePub downloads, according to the available data) and Abstracts Views on Vision4Press platform.
Data correspond to usage on the plateform after 2015. The current usage metrics is available 48-96 hours after online publication and is updated daily on week days.
Initial download of the metrics may take a while.