Fig. 12
Download original image
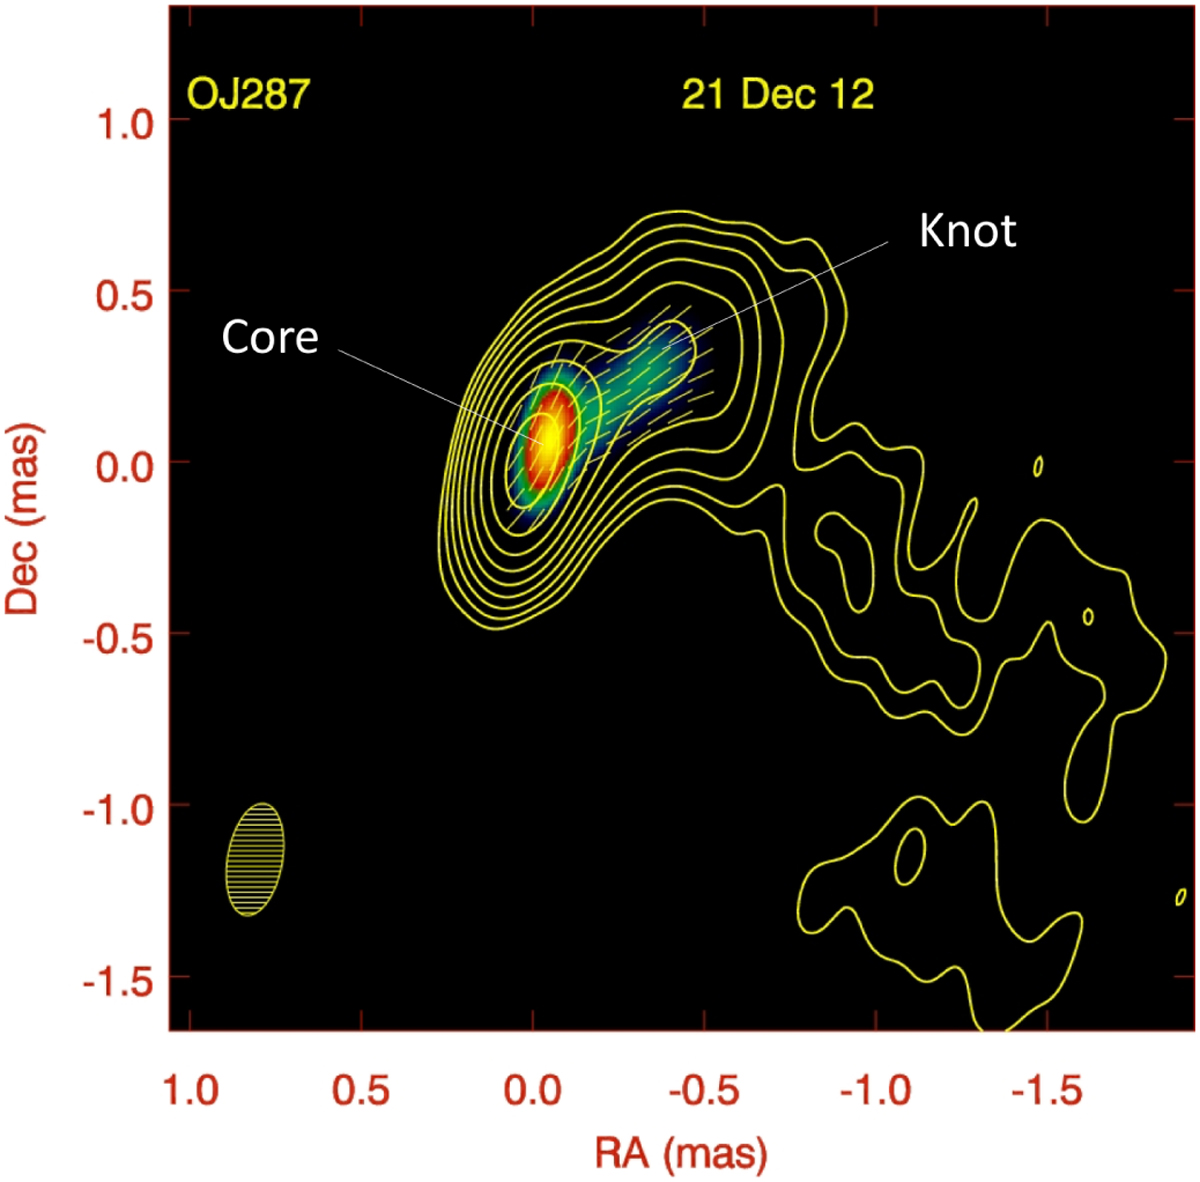
VLBA image of OJ 287 at 43 GHz at epoch 2012 December 21 (MJD 56282). The contours represent total intensity, starting at 0.25% of the maximum of 0.79 Jy beam−1 and increasing by factors of 2. The color scale represents linearly polarized intensity, with maximum value (yellow) of 0.032 Jy beam−1. The yellow line segments indicate the EVPA. The restoring beam FWHM, representing the angular resolution, is displayed in the lower left corner.
Current usage metrics show cumulative count of Article Views (full-text article views including HTML views, PDF and ePub downloads, according to the available data) and Abstracts Views on Vision4Press platform.
Data correspond to usage on the plateform after 2015. The current usage metrics is available 48-96 hours after online publication and is updated daily on week days.
Initial download of the metrics may take a while.