Fig. D.2.
Download original image
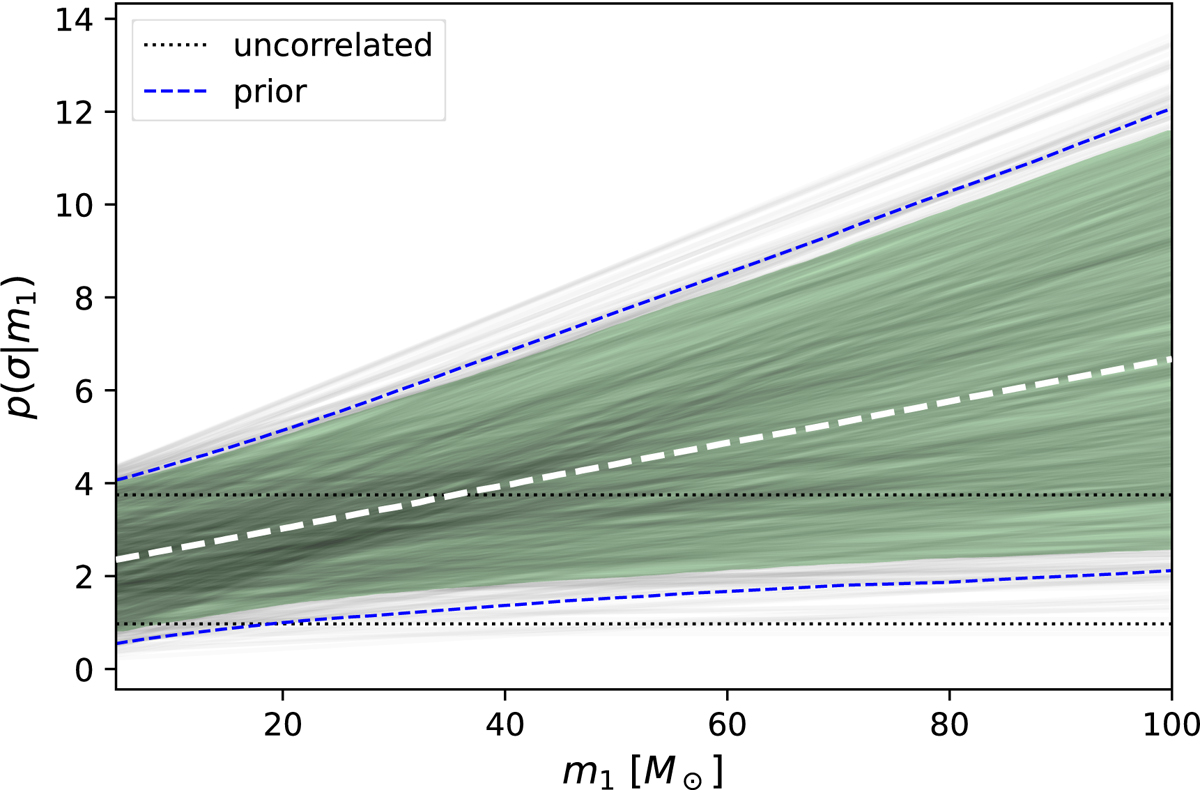
Posterior of the standard deviation of the Gaussian component for the Isotropic + correlated Gaussian model, when we allowed for correlation with the component masses, as a function of the primary mass m1. The thin black lines are individual posterior draws, the colored band is the 90% CI, and the thick dashed line is the median. The two horizontal think dotted lines enclose the 90% CI for the Isotropic + Gaussian model, which does not allow for correlations. Finally, the two thin blue dashed lines enclose the 90% CI obtained sampling the prior.
Current usage metrics show cumulative count of Article Views (full-text article views including HTML views, PDF and ePub downloads, according to the available data) and Abstracts Views on Vision4Press platform.
Data correspond to usage on the plateform after 2015. The current usage metrics is available 48-96 hours after online publication and is updated daily on week days.
Initial download of the metrics may take a while.