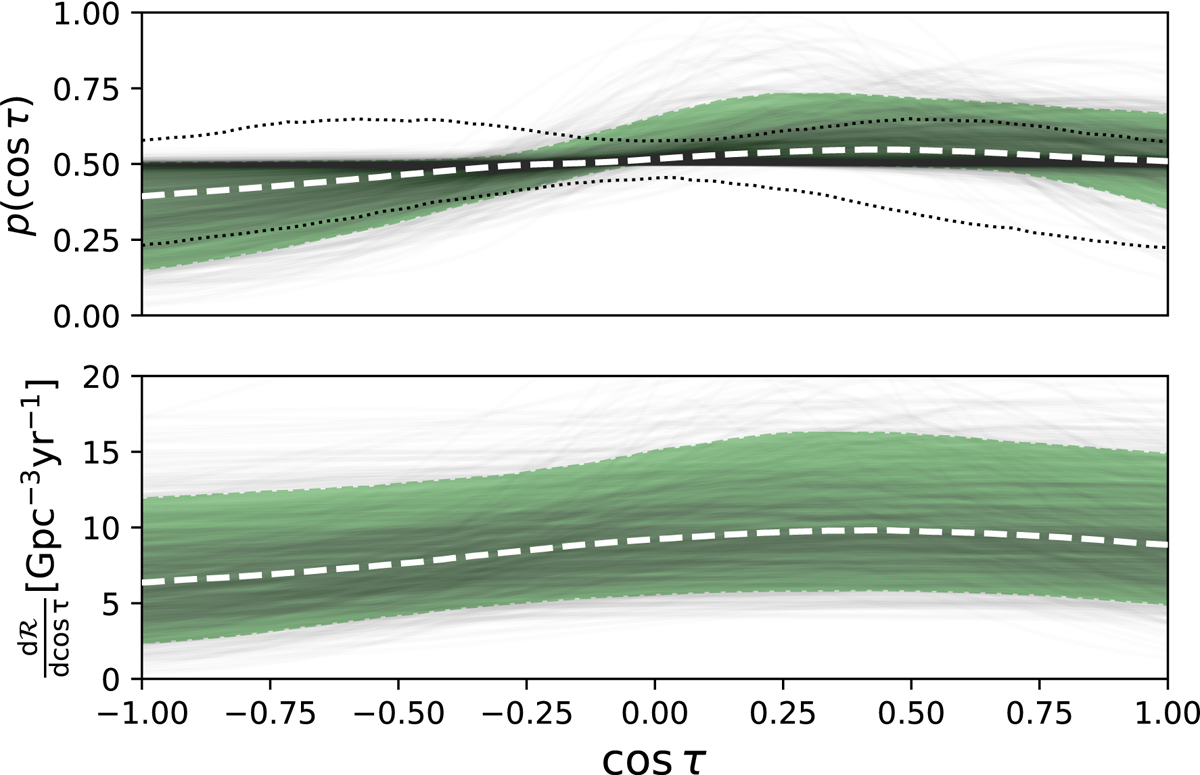
Fig. 1.
Download original image
Posterior for cosτ (top panel) and differential merger rate per unit cosτ (bottom panel) obtained using the Isotropic + Gaussian model when the mean of the Gaussian component is allowed to vary in the range μ ∈ [ − 1, 1]. The two thin black dotted lines in the top panel show the 90% CI obtained by drawing the model’s hyperparameters from their priors. In both panels, the thin black lines represent individual posterior draws, whereas the colored band shows the 90% CI. The thick dashed line within the band is the median.
Current usage metrics show cumulative count of Article Views (full-text article views including HTML views, PDF and ePub downloads, according to the available data) and Abstracts Views on Vision4Press platform.
Data correspond to usage on the plateform after 2015. The current usage metrics is available 48-96 hours after online publication and is updated daily on week days.
Initial download of the metrics may take a while.