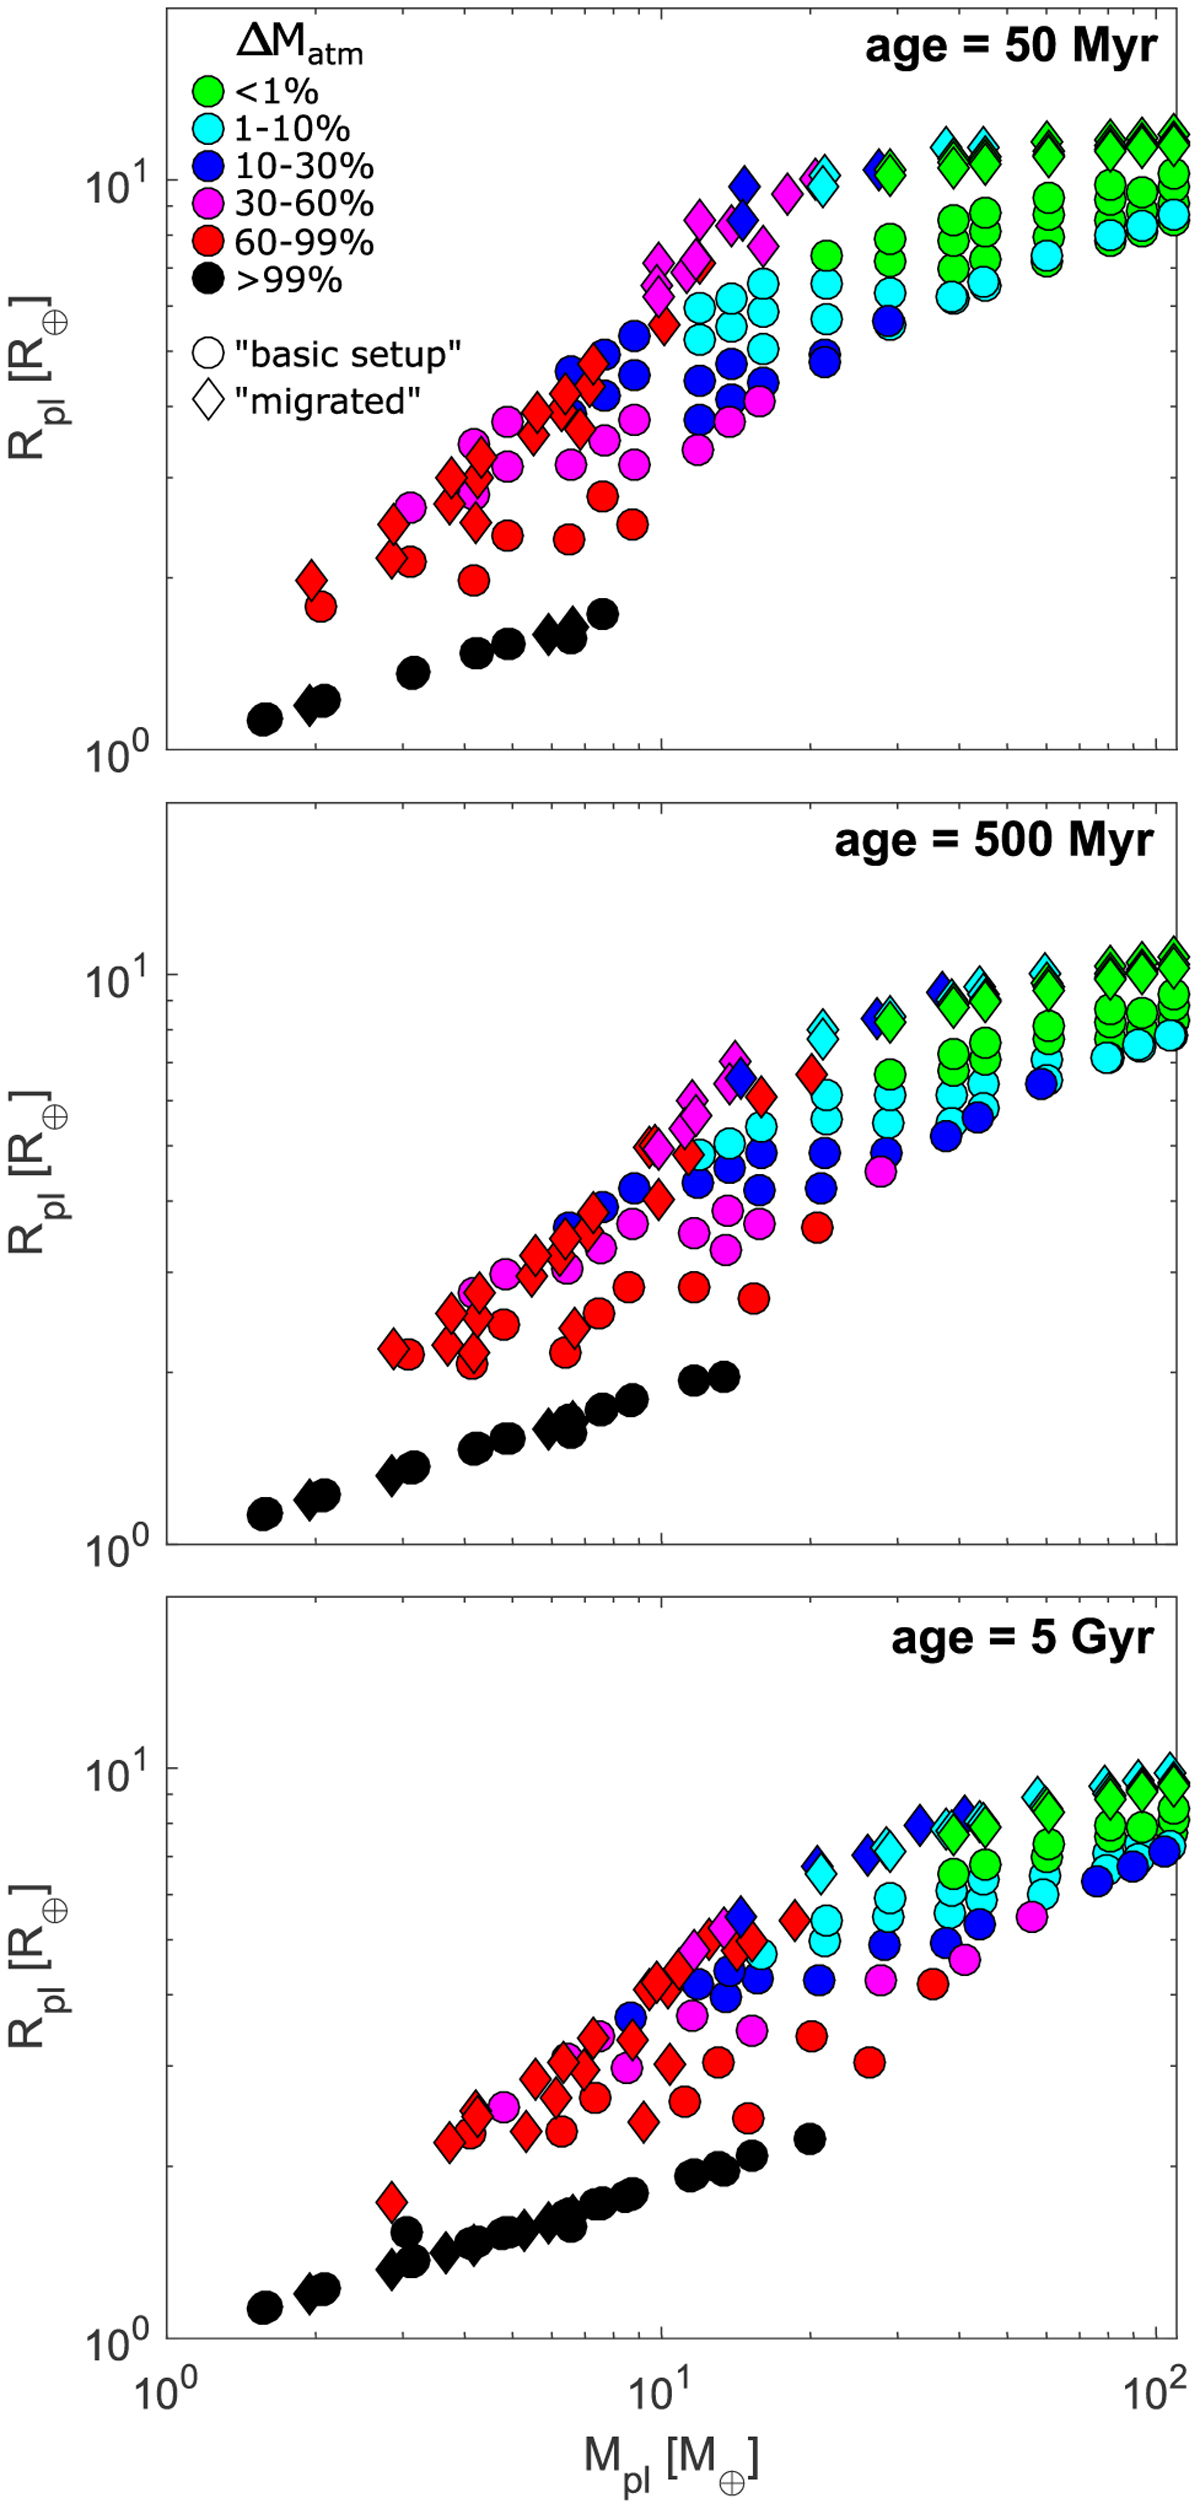
Fig. 8
Download original image
Synthetic MR diagram color-coded according to the fraction of primordial atmosphere that has been lost through escape at 50 Myr (top), 500 Myr (middle), and 5 Gyr (bottom) for the entire model population (i.e., 0.03–0.35 AU). The color code is defined in the legend in the top left corner of the top panel. Circles and diamonds correspond to the initial conditions set according to the basic-setup and migrated scenarios, respectively.
Current usage metrics show cumulative count of Article Views (full-text article views including HTML views, PDF and ePub downloads, according to the available data) and Abstracts Views on Vision4Press platform.
Data correspond to usage on the plateform after 2015. The current usage metrics is available 48-96 hours after online publication and is updated daily on week days.
Initial download of the metrics may take a while.