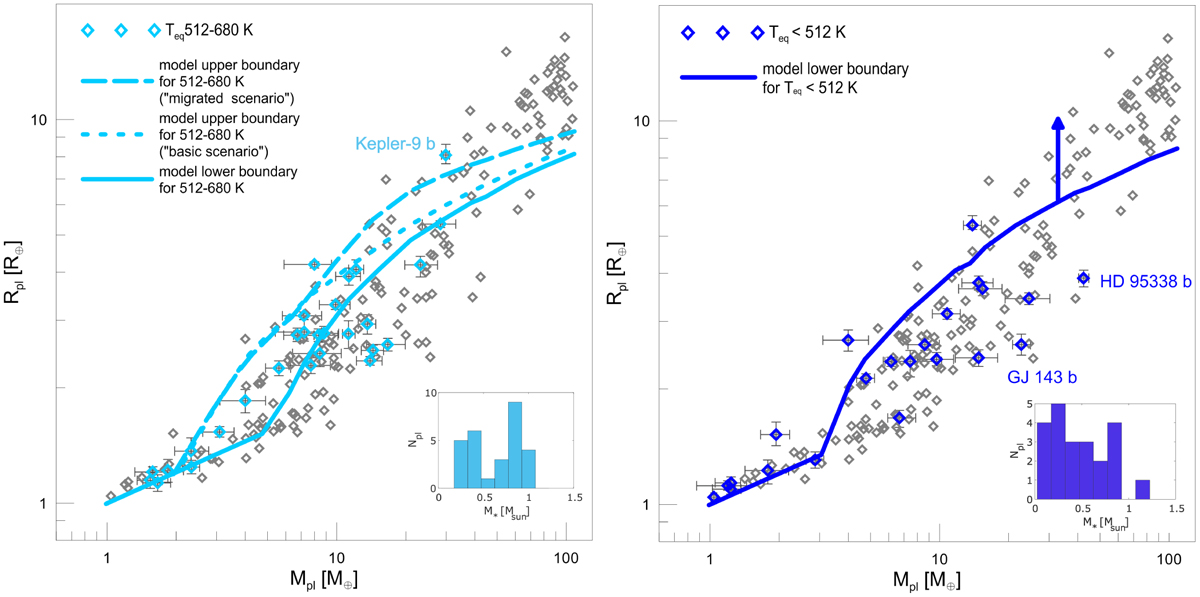
Fig. 6
Download original image
Same as Fig. 3, but for the 512–680 Κ (left panel, light blue) and <512 Κ (right panel, dark blue) temperature range. Planets from other temperature intervals, shown in black, are included in the plots for clarity. The light blue (left panel) and dark blue (right panel) solid lines indicate the lower boundary of the theoretical radius spread for the respective temperature intervals. The long-dashed and short-dashed light blue lines (left panel) indicate the upper boundaries of the radius spread in the 512–680 Κ interval according to the migrated and basic-setup scenarios, respectively. For context, the inset located in the bottom right corner shows the mass distribution of the stars hosting the observed planets lying within each considered temperature range.
Current usage metrics show cumulative count of Article Views (full-text article views including HTML views, PDF and ePub downloads, according to the available data) and Abstracts Views on Vision4Press platform.
Data correspond to usage on the plateform after 2015. The current usage metrics is available 48-96 hours after online publication and is updated daily on week days.
Initial download of the metrics may take a while.