Fig. 5
Download original image
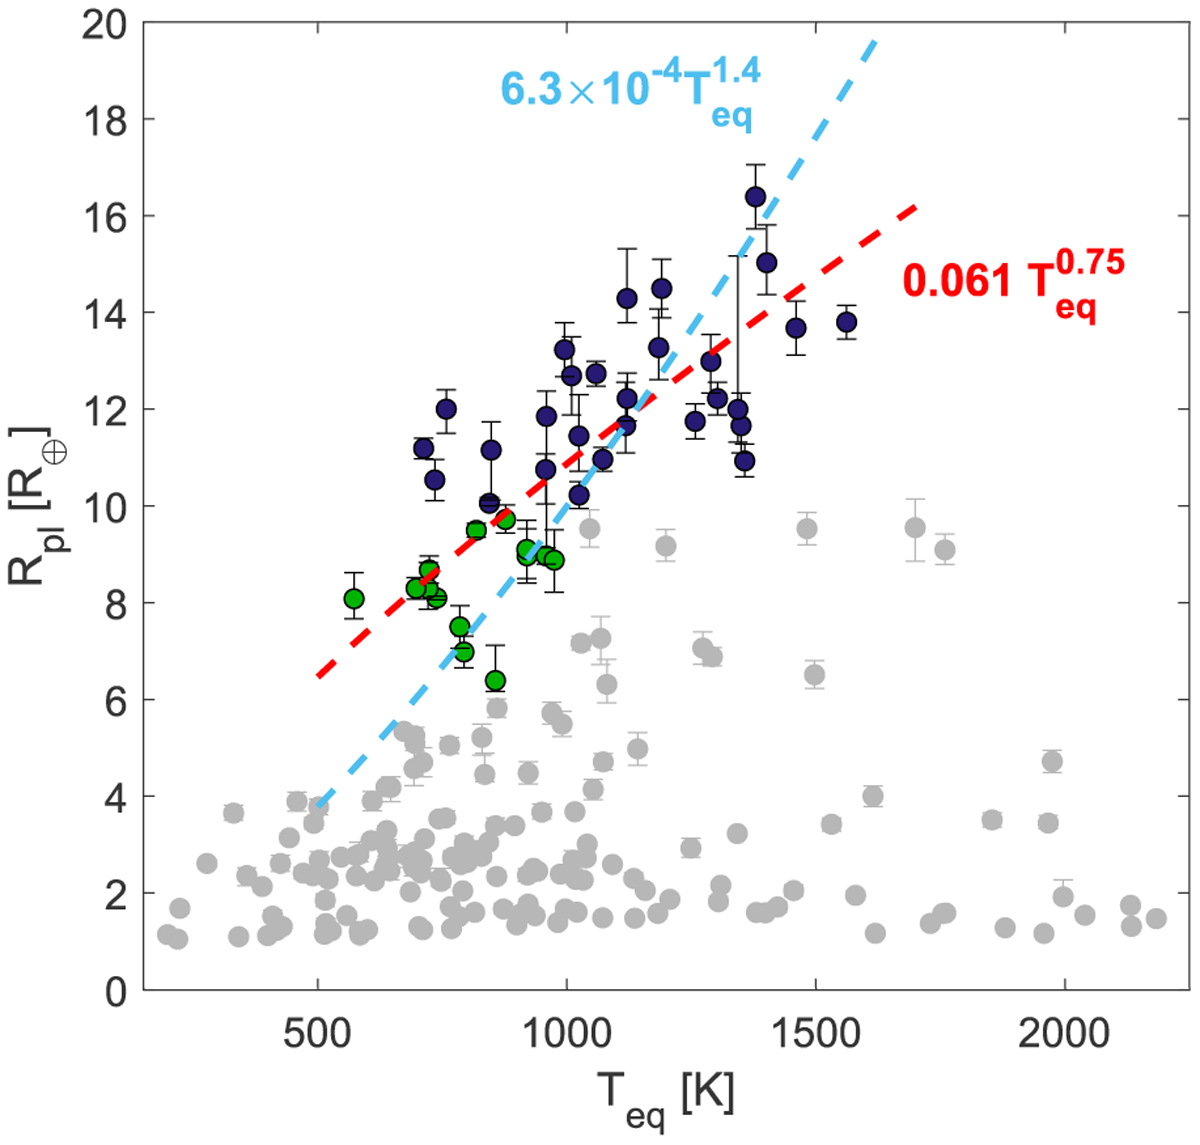
Radii of the observed planets as a function of equilibrium temperature. The black points mark the group of inflated Saturns discussed in the text (Rpl ≥ 10 R⊕), and the green points are planets with 6 ≤ Rpl < 10 R⊕ and Teq < 1000 K. All other planets are marked in gray. The dashed red line shows the fit to the black points, and the dashed blue line shows the fit to these planets assuming the exponent obtained for the inflated hot Jupiters (Laughlin et al. 2011).
Current usage metrics show cumulative count of Article Views (full-text article views including HTML views, PDF and ePub downloads, according to the available data) and Abstracts Views on Vision4Press platform.
Data correspond to usage on the plateform after 2015. The current usage metrics is available 48-96 hours after online publication and is updated daily on week days.
Initial download of the metrics may take a while.