Fig. 4
Download original image
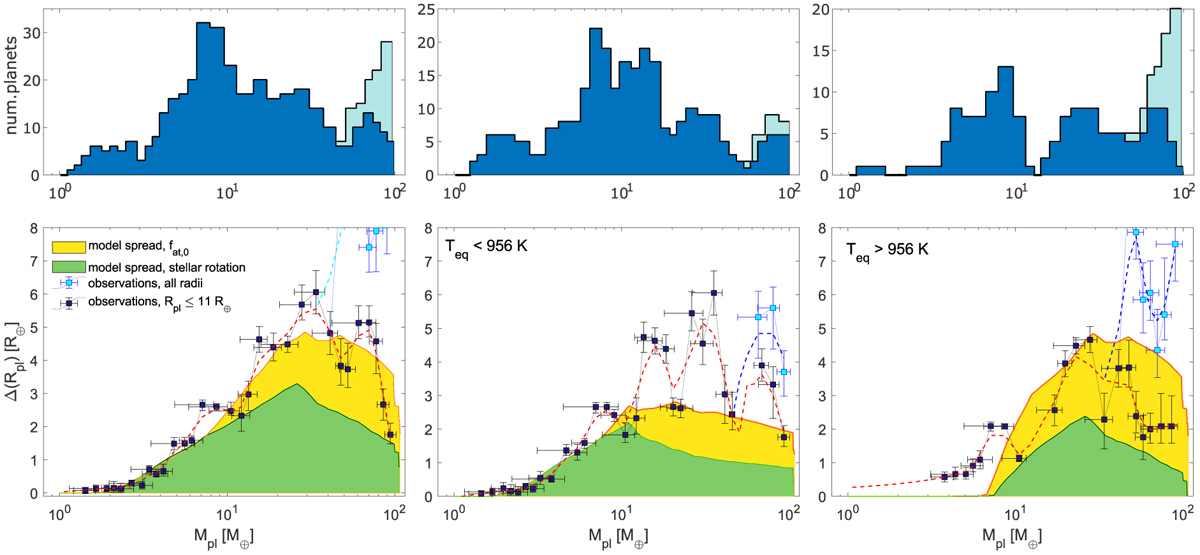
The comparison between the observed ΔRpl,obs and synthetic ΔRpl,model radius spread values as a function of planetary mass for the whole temperature range and for planets cooler or hotter than 956 K. Bottom panels: Comparison between the measured (squares) and synthetic (areas) spread in planetary radii as a function of planetary mass (ΔRpl = Rpl,max – Rpl,min) for the entire sample (left), for planets cooler than 956 K (middle), and for planets hotter than 956 K (right). The relative values for the observed ΔRpl distribution are listed in Tables B.1–B.3, respectively, but with the difference that for visualisation purposes, we combined neighbouring bins whose ΔRpl values differed by less than 1% in the plots. In the high-mass range, the blue and black squares have been obtained by accounting and disregarding, respectively, planets affected by atmospheric inflation (i.e., planets with a radius larger than 11 R⊕). The green area is for the basic scenario and accounts for the variability in the initial stellar rotation rate affecting atmospheric mass loss. The yellow area is for the migrated scenario, and thus it accounts for larger initial atmospheric mass fractions (assuming the host star was a slow rotator). To guide the eye, the dashed red line is a smoothed distribution of the black squares. Top panels: Histograms of the number of observed planets within each mass bin for the entire sample (left), for planets cooler than 956 K (middle), and for planets hotter than 956 K (right). The dark blue and bright blue areas account for and disregard, respectively, planets affected by atmospheric inflation.
Current usage metrics show cumulative count of Article Views (full-text article views including HTML views, PDF and ePub downloads, according to the available data) and Abstracts Views on Vision4Press platform.
Data correspond to usage on the plateform after 2015. The current usage metrics is available 48-96 hours after online publication and is updated daily on week days.
Initial download of the metrics may take a while.