Fig. 3
Download original image
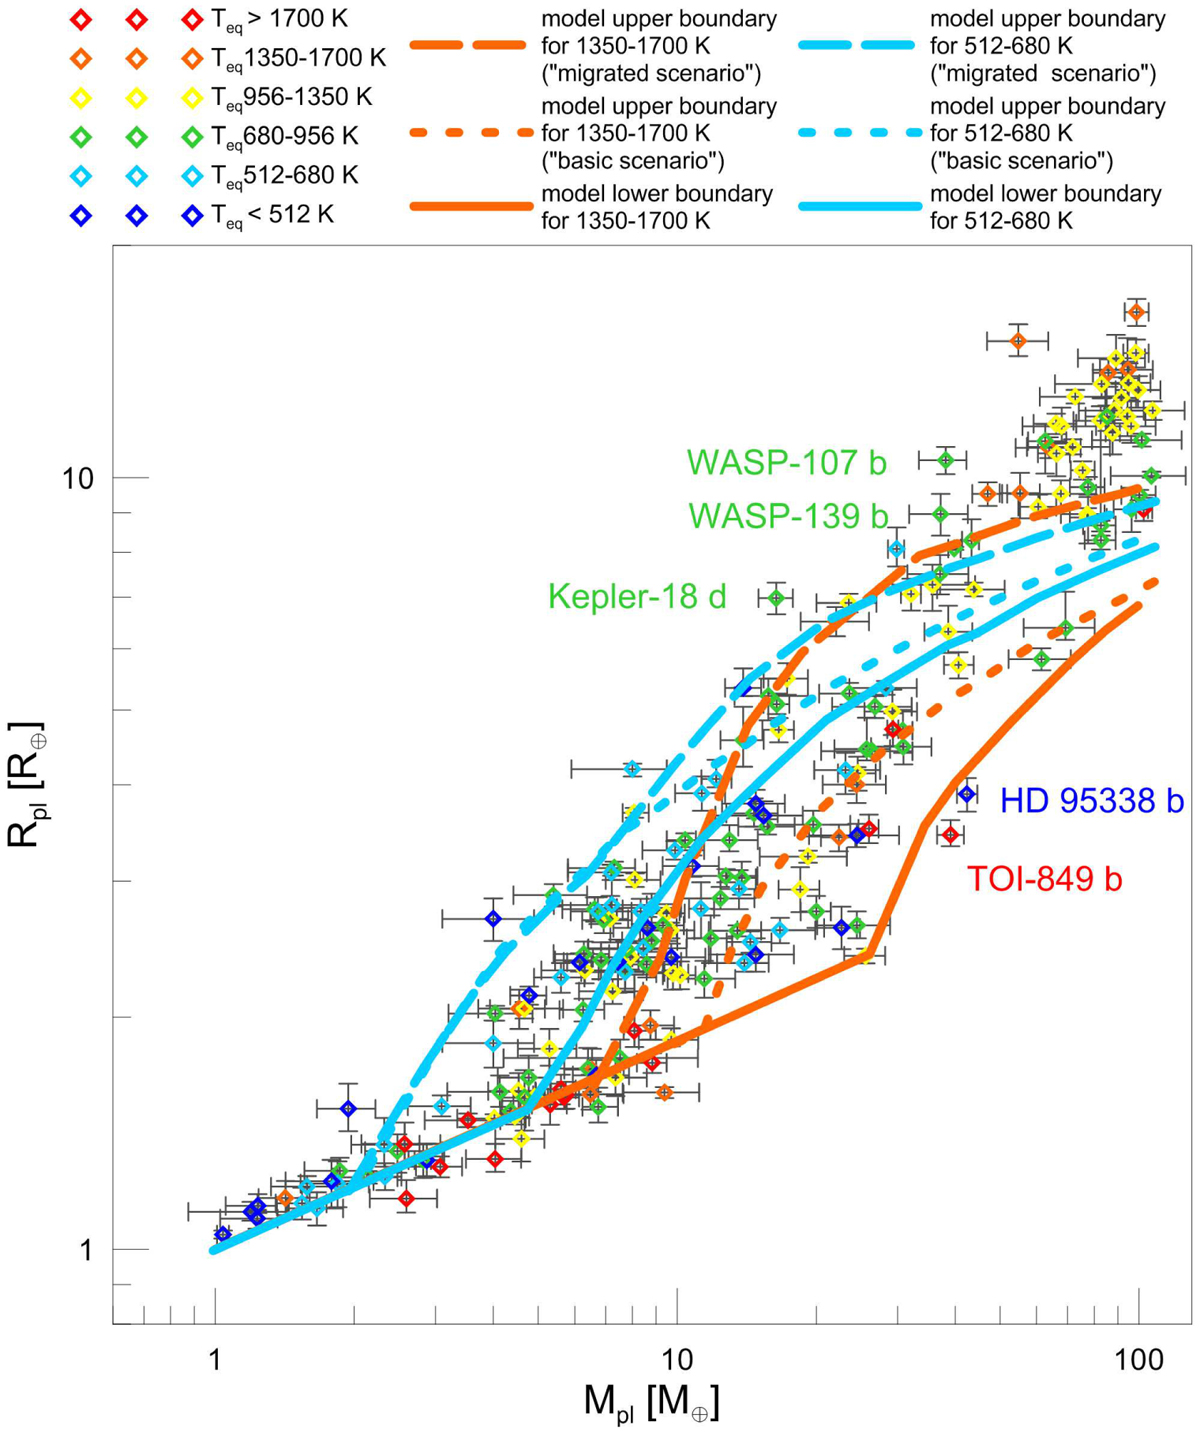
MR distribution of the selected observed planets in comparison to modeling results. The symbol color indicates the approximate planetary equilibrium temperature as given in the legend. The largest uncertainties are 45% on planetary mass and 15% on planetary radius. The solid and long-dashed lines enclose the maximum predicted spreads in planetary radius at the age of 5 Gyr, obtained by considering the entire set of atmospheric evolutionary tracks computed in the 512–680 K (light blue lines) and 1350–1700 K (orange lines) temperature intervals, where the upper boundary is given by the migrated scenario. For reference, the short-dashed lines show the upper boundary predicted for the basicsetup scenario.
Current usage metrics show cumulative count of Article Views (full-text article views including HTML views, PDF and ePub downloads, according to the available data) and Abstracts Views on Vision4Press platform.
Data correspond to usage on the plateform after 2015. The current usage metrics is available 48-96 hours after online publication and is updated daily on week days.
Initial download of the metrics may take a while.