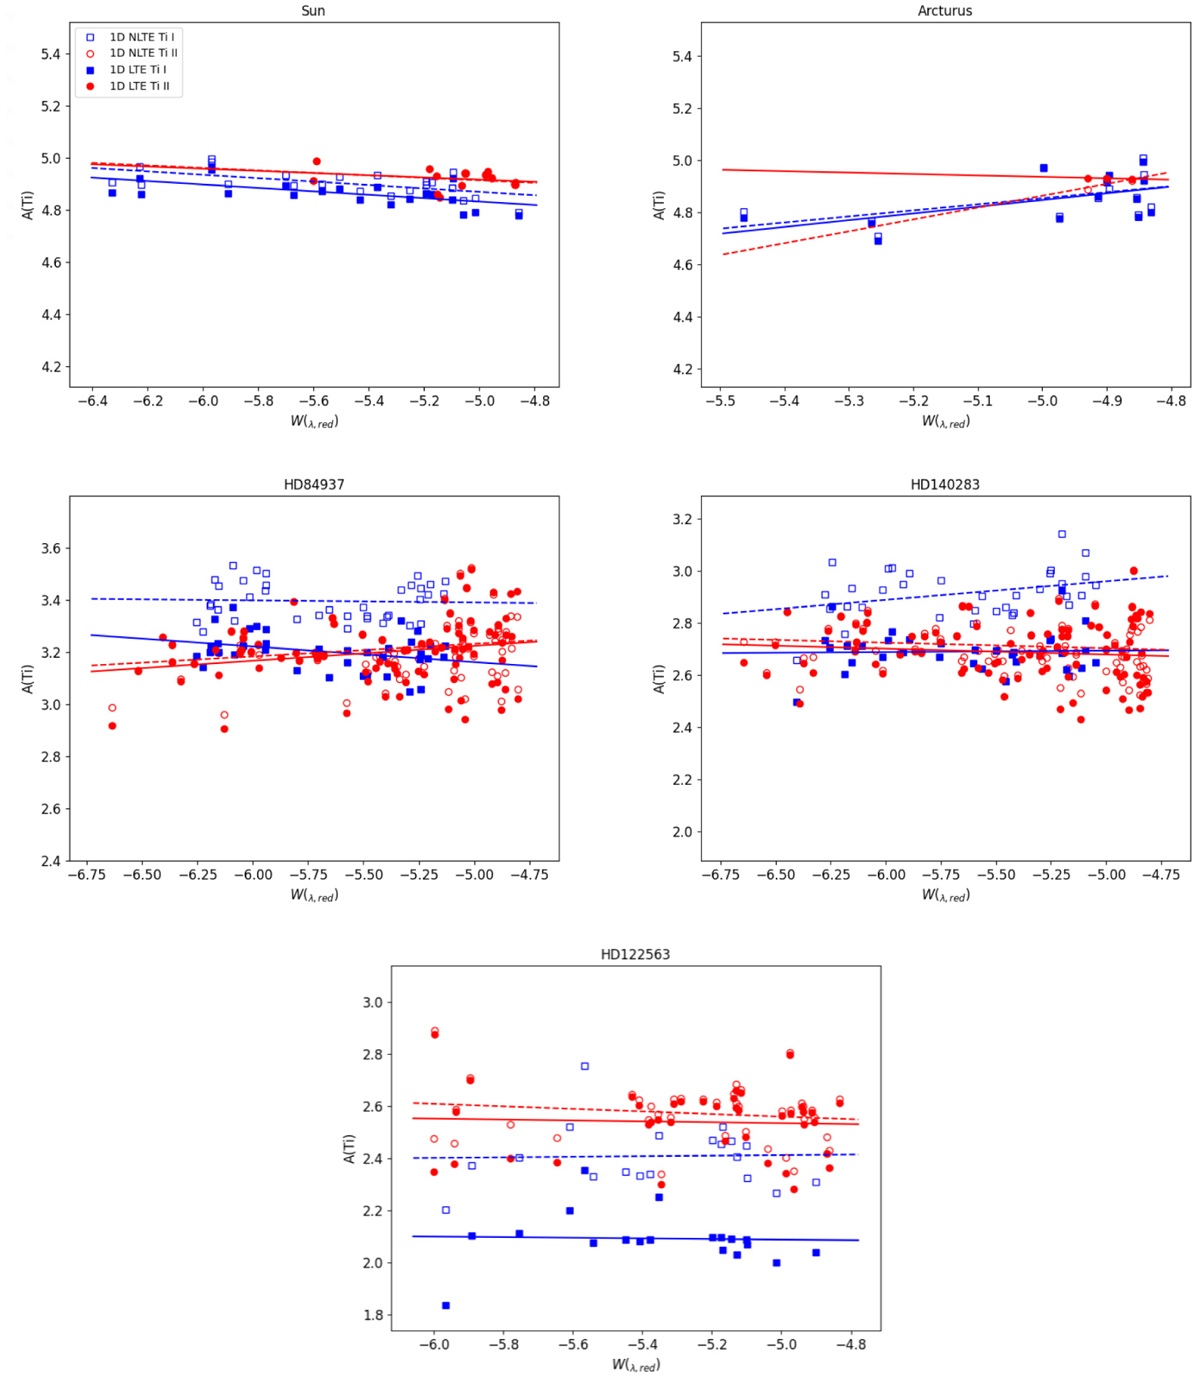
Fig. 6
Download original image
Difference between the mean abundance of Ti I and Ti II in LTE and non-LTE for all stars, representing the ionisation imbalance. Filled symbols represent LTE and empty symbols non-LTE. Red circles and lines show Ti II and blue squares Ti I. Lines represent the abundance trend, dashed for non-LTE and solid for LTE. The x-axis is the reduced equivalent width: log10(Wλ/λ).
Current usage metrics show cumulative count of Article Views (full-text article views including HTML views, PDF and ePub downloads, according to the available data) and Abstracts Views on Vision4Press platform.
Data correspond to usage on the plateform after 2015. The current usage metrics is available 48-96 hours after online publication and is updated daily on week days.
Initial download of the metrics may take a while.