Fig. 1
Download original image
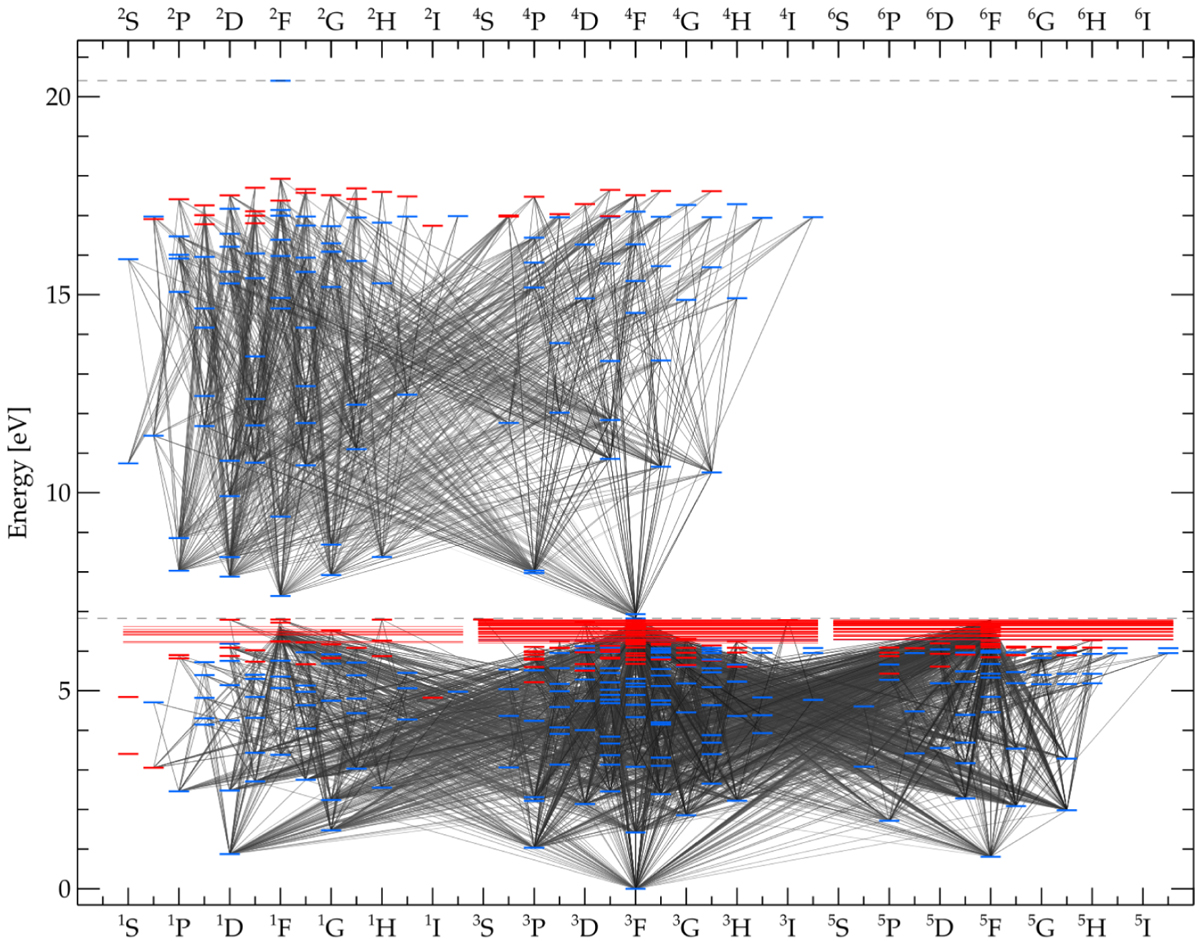
Term diagram of the reduced atom showing the energies for possible bound-bound transitions of Ti I (lower half) and Ti II (upper half). Transitions are shown by black lines, with darker lines representing a higher oscillator strength. Blue marks show the observed energy levels, and red marks show levels that are theoretically predicted.
Current usage metrics show cumulative count of Article Views (full-text article views including HTML views, PDF and ePub downloads, according to the available data) and Abstracts Views on Vision4Press platform.
Data correspond to usage on the plateform after 2015. The current usage metrics is available 48-96 hours after online publication and is updated daily on week days.
Initial download of the metrics may take a while.