Open Access
Fig. C.4
Download original image
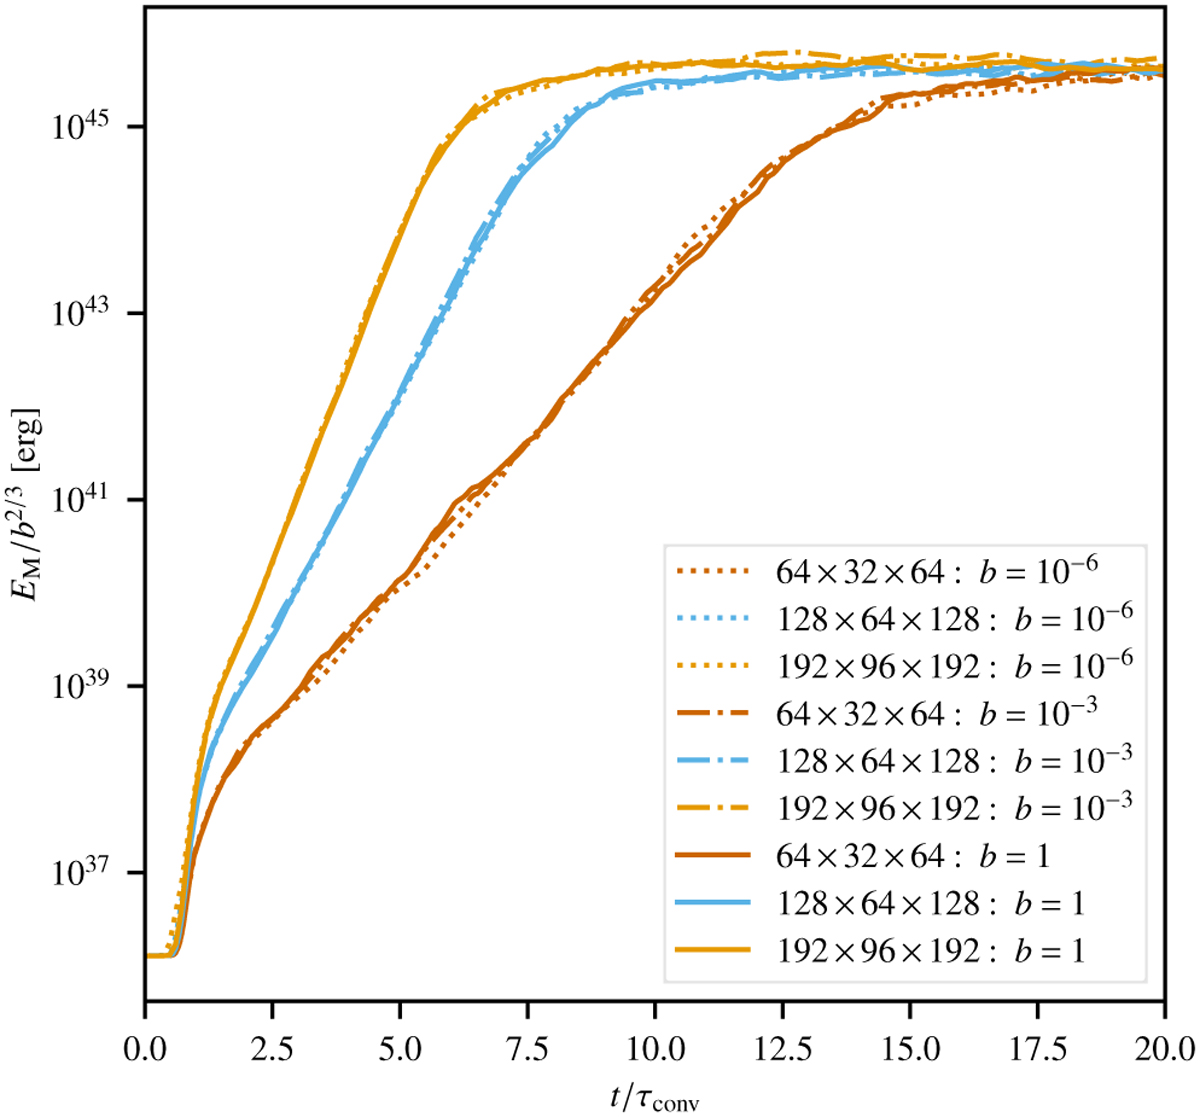
Time evolution of the magnetic energy in the simulations of the SSD up to t/τconv = 20. Each line style represents a specific value of the boost factor, b, while different colors are used for different numbers of grid cells.
Current usage metrics show cumulative count of Article Views (full-text article views including HTML views, PDF and ePub downloads, according to the available data) and Abstracts Views on Vision4Press platform.
Data correspond to usage on the plateform after 2015. The current usage metrics is available 48-96 hours after online publication and is updated daily on week days.
Initial download of the metrics may take a while.