Fig. C.1
Download original image
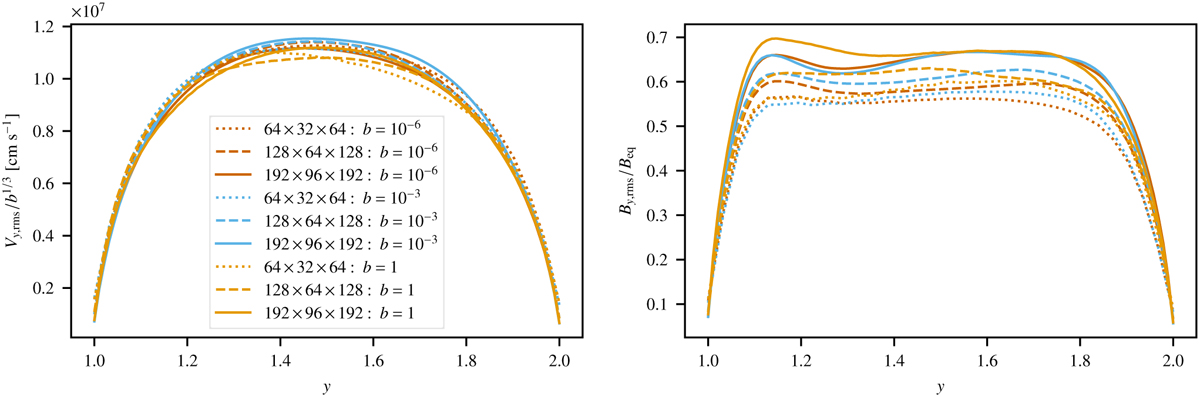
Vertical profiles of Vy (left) and Βν (right) in the simulations of the SSD, averaged over 20 < t/τconv < 40. Different colors represent different grid resolutions, while different line styles are used for representing different values of b. The vertical velocity is rescaled by b2/3 to remove the dependence of the energy injection rate, while Βy is rescaled by the corresponding equipartition value, ![]() .
.
Current usage metrics show cumulative count of Article Views (full-text article views including HTML views, PDF and ePub downloads, according to the available data) and Abstracts Views on Vision4Press platform.
Data correspond to usage on the plateform after 2015. The current usage metrics is available 48-96 hours after online publication and is updated daily on week days.
Initial download of the metrics may take a while.