Open Access
Fig. B.2
Download original image
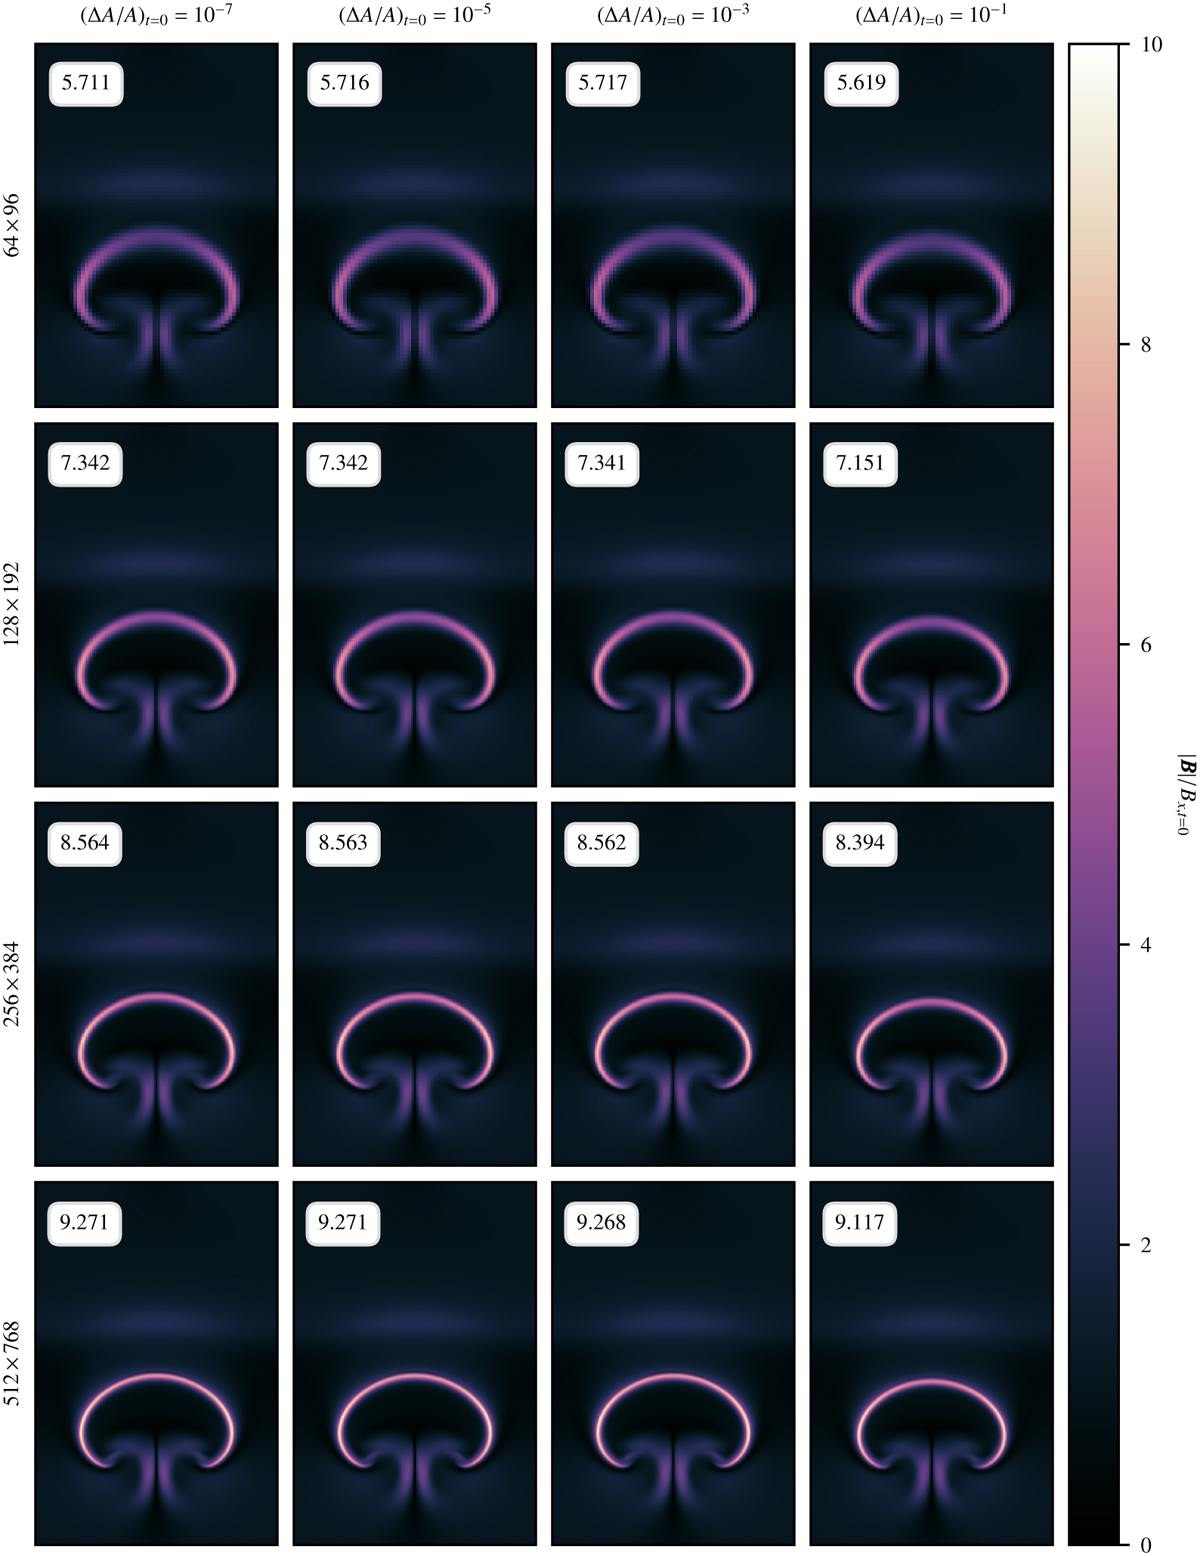
Final distribution of ∣B∣/Bx,t=0 for different values of (ΔA/A)t=0 and grid resolutions in the simulations of the hot bubble. The insets show the maximum ratio in each panel. The amount of numerical resistivity decreases upon grid refinement, which leads to the generation of narrower stripes with stronger magnetic fields.
Current usage metrics show cumulative count of Article Views (full-text article views including HTML views, PDF and ePub downloads, according to the available data) and Abstracts Views on Vision4Press platform.
Data correspond to usage on the plateform after 2015. The current usage metrics is available 48-96 hours after online publication and is updated daily on week days.
Initial download of the metrics may take a while.