Open Access
Fig. B.1
Download original image
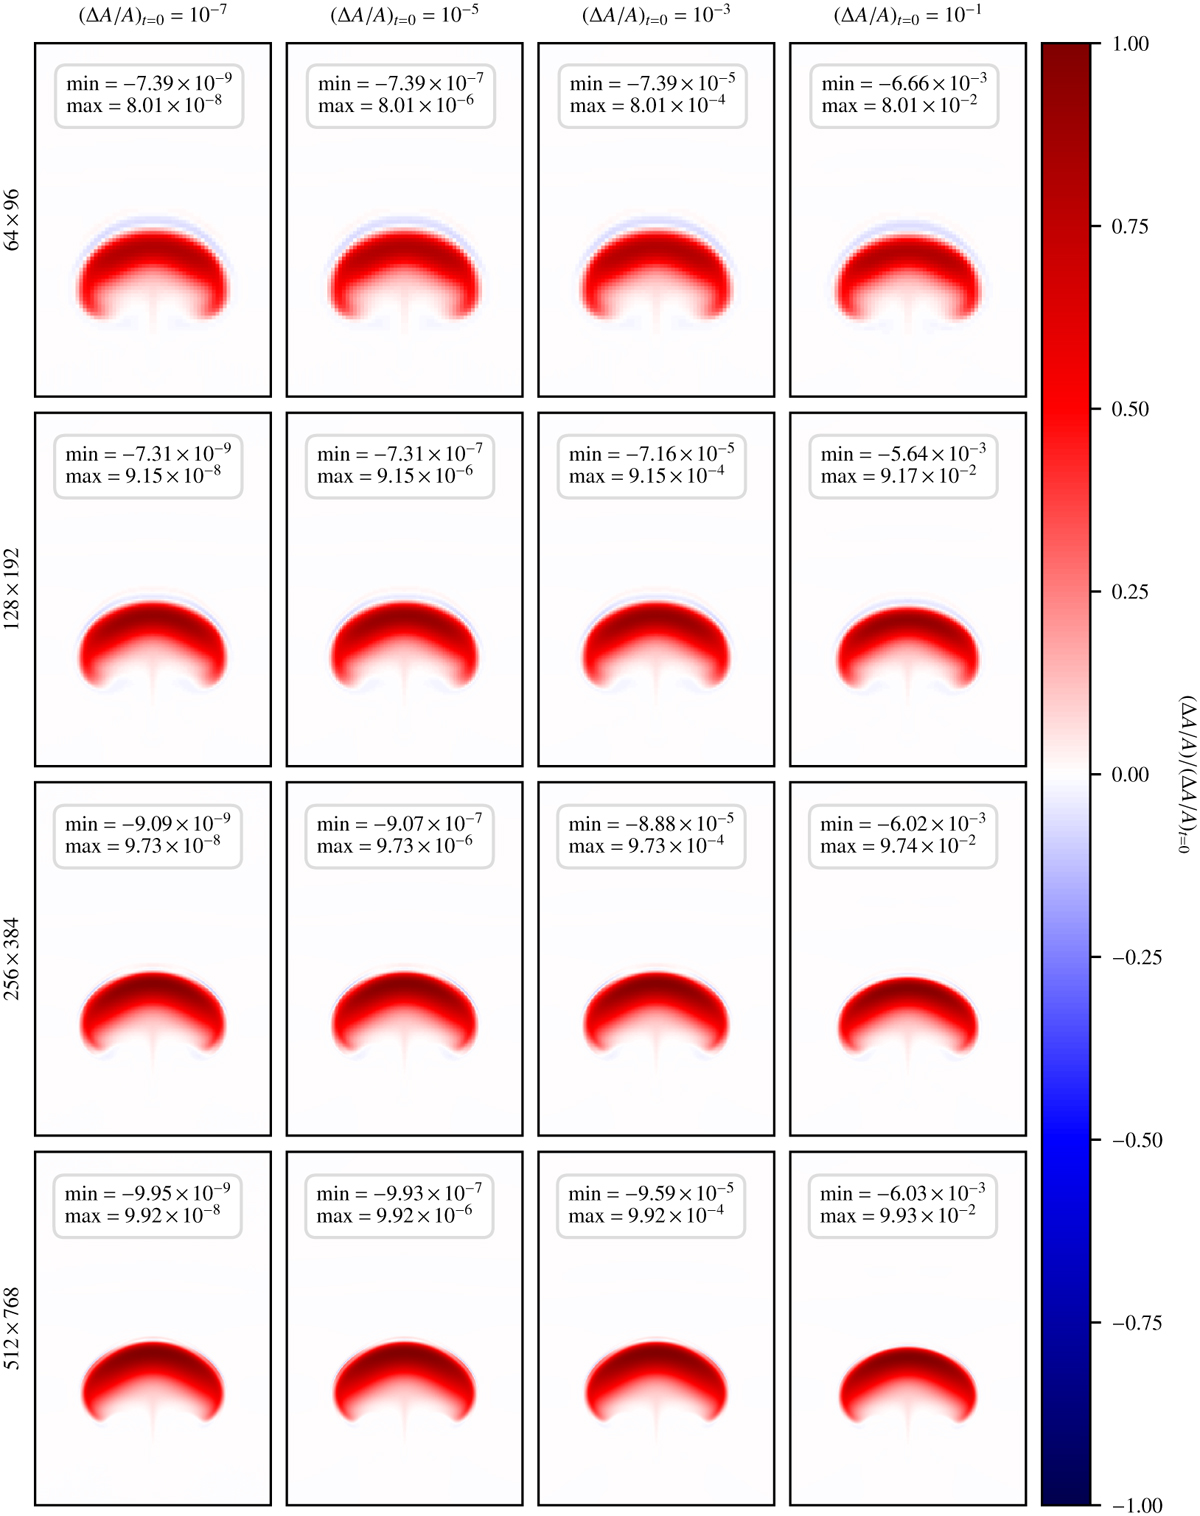
Final distribution of the entropy fluctuations, ΔA/A, of the hot bubble for different values of (ΔA/A)t=0 and grid resolutions. Each panel is rescaled by the corresponding value of (ΔA/A)t=0. The insets provide the minimum and maximum values of the entropy fluctuations in each plot.
Current usage metrics show cumulative count of Article Views (full-text article views including HTML views, PDF and ePub downloads, according to the available data) and Abstracts Views on Vision4Press platform.
Data correspond to usage on the plateform after 2015. The current usage metrics is available 48-96 hours after online publication and is updated daily on week days.
Initial download of the metrics may take a while.