Open Access
Fig. 18
Download original image
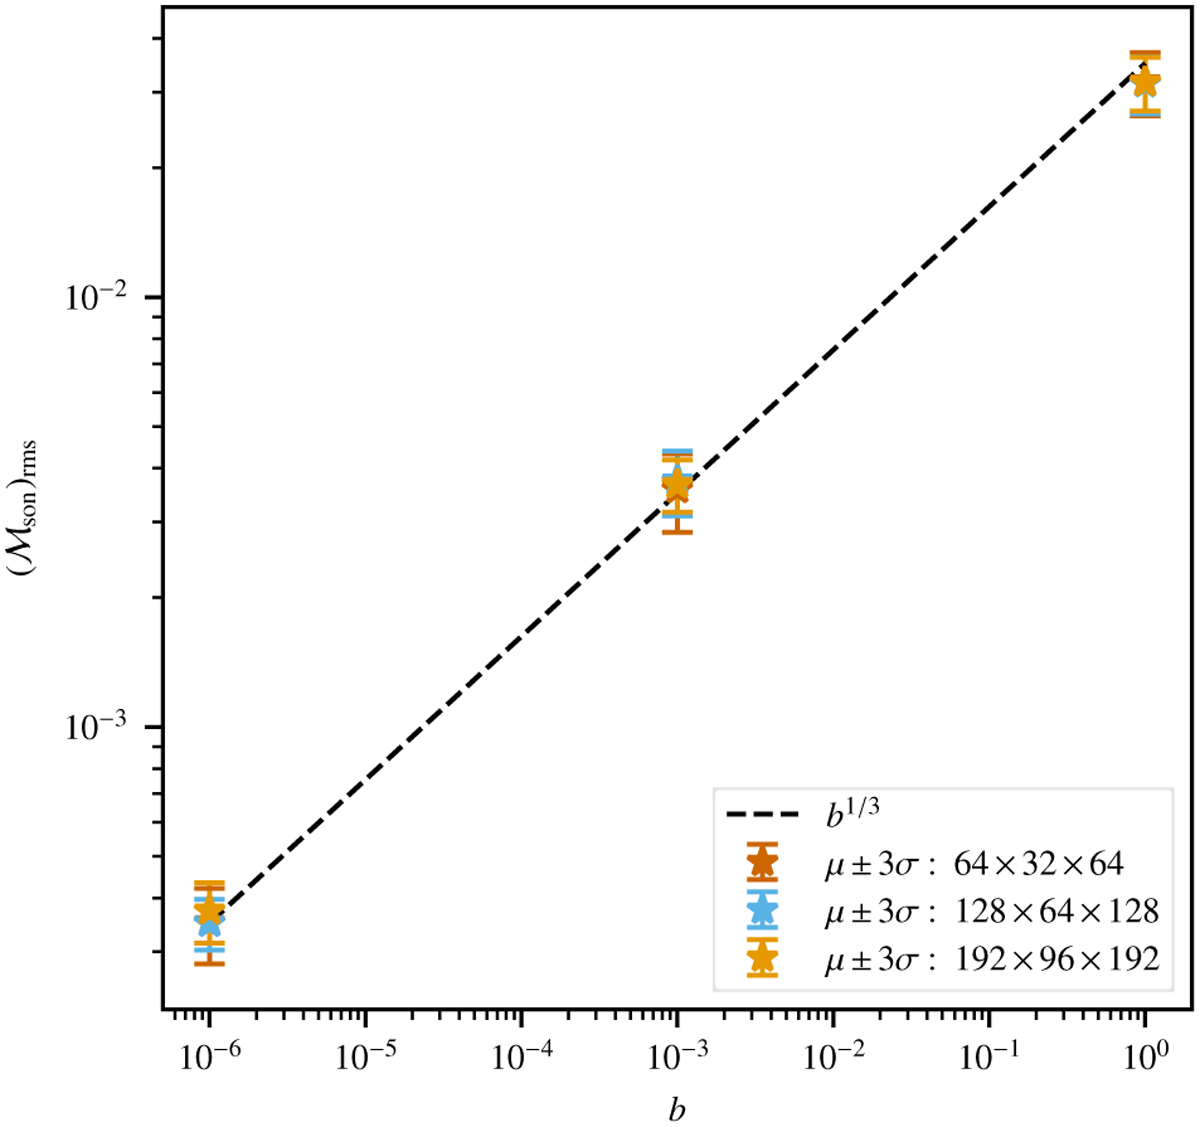
Root mean square of the sonic Mach number as a function of the driving luminosity b. The data points are averages computed in the time interval 20 < t/τcom < 40. The error bars represent three standard deviations over the time series, while the dotted black line is the b1/3 scaling.
Current usage metrics show cumulative count of Article Views (full-text article views including HTML views, PDF and ePub downloads, according to the available data) and Abstracts Views on Vision4Press platform.
Data correspond to usage on the plateform after 2015. The current usage metrics is available 48-96 hours after online publication and is updated daily on week days.
Initial download of the metrics may take a while.