Fig. 17
Download original image
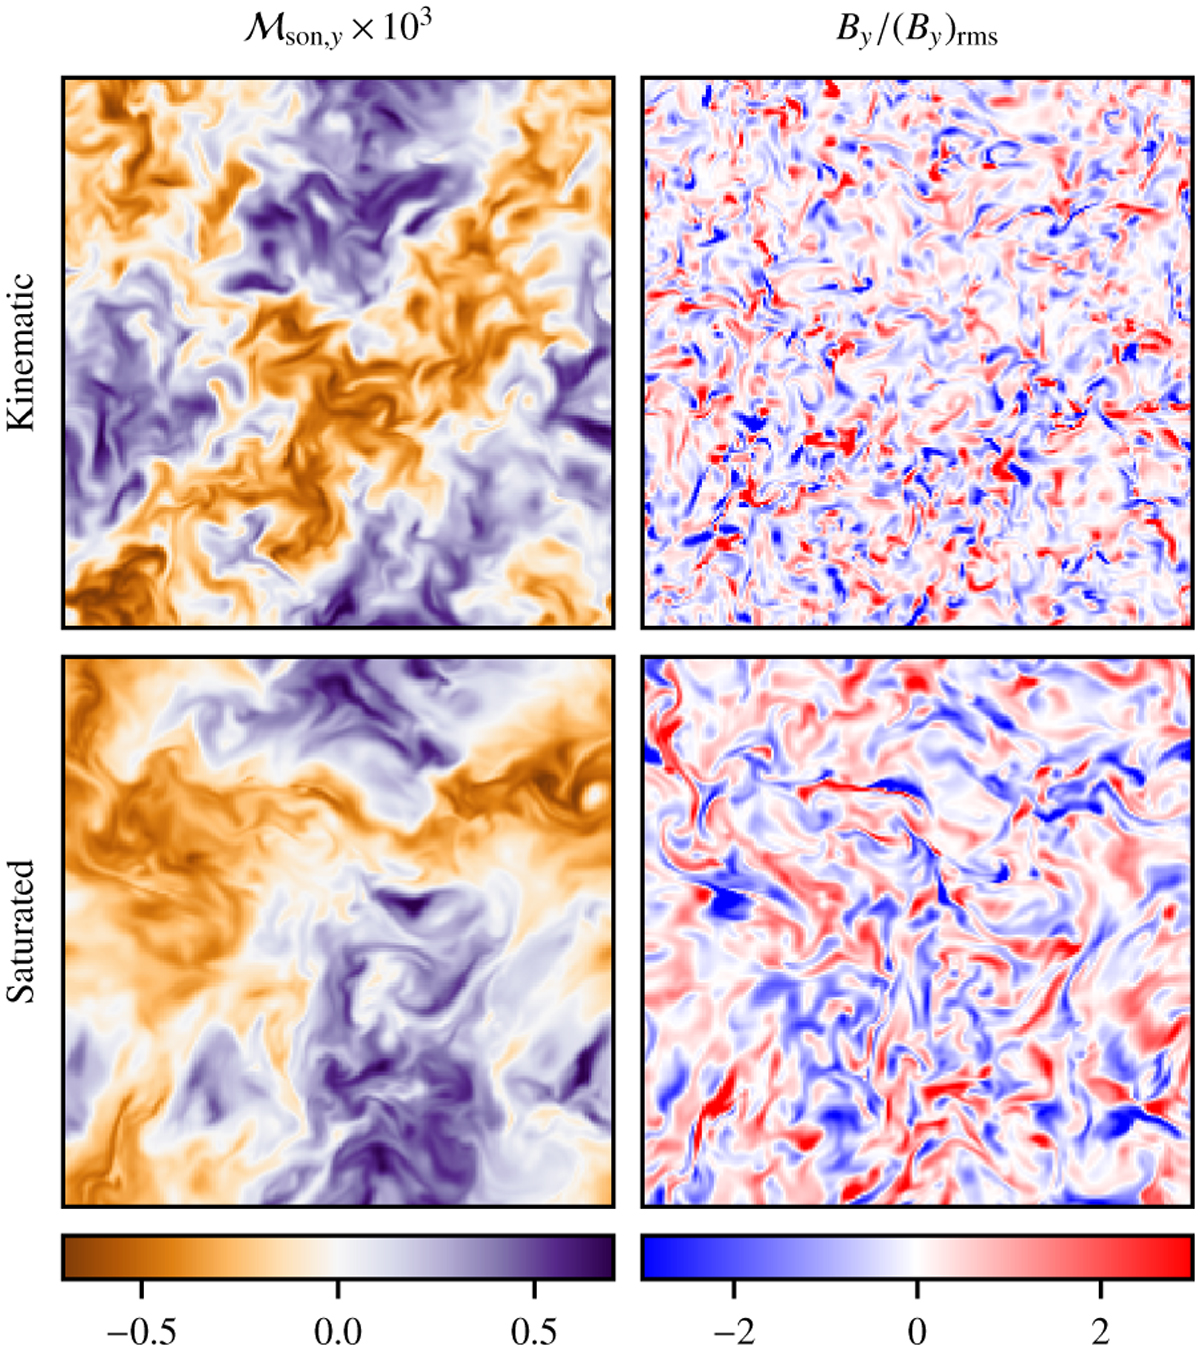
Horizontal slices in the y = 1.5 plane taken in the kinematic (upper plots) and saturated (lower plots) regimes of the SSD with b = 10−6 on the 192 × 96 × 192 grid. The panels on the left show the vertical sonic Mach number ℳson,y = Vy/a multiplied by 103, while the plots on the right show the vertical magnetic field rescaled by the root mean square value across the plane.
Current usage metrics show cumulative count of Article Views (full-text article views including HTML views, PDF and ePub downloads, according to the available data) and Abstracts Views on Vision4Press platform.
Data correspond to usage on the plateform after 2015. The current usage metrics is available 48-96 hours after online publication and is updated daily on week days.
Initial download of the metrics may take a while.