Fig. 16
Download original image
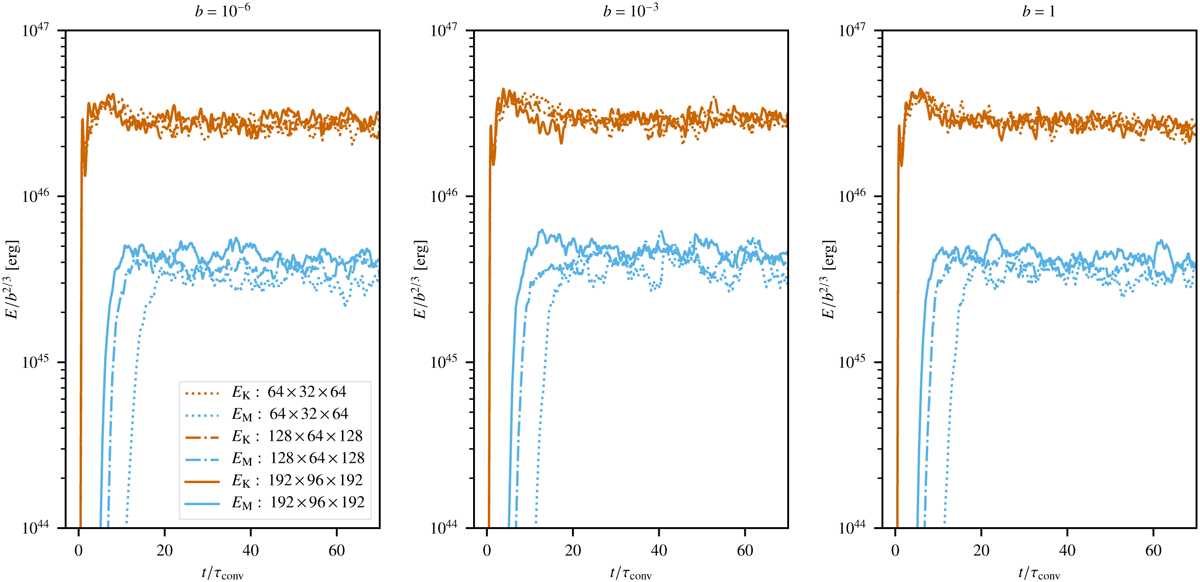
Time evolution of the magnetic energy (sky blue) and kinetic energy (vermillion) in the simulations of the SSD for different grid resolutions (dotted: 64 × 32 × 64, dot-dashed: 128 × 64 × 128, solid: 192 × 96 × 192). Each panel shows the results obtained with a specific value of b (from left to right: b = 10−6, 10−3, 1). The time is expressed in units of the convective turnover, while the magnetic and kinetic energy curves are rescaled by b2/3 to take into account the different energy contents of the flows.
Current usage metrics show cumulative count of Article Views (full-text article views including HTML views, PDF and ePub downloads, according to the available data) and Abstracts Views on Vision4Press platform.
Data correspond to usage on the plateform after 2015. The current usage metrics is available 48-96 hours after online publication and is updated daily on week days.
Initial download of the metrics may take a while.