Fig. 15
Download original image
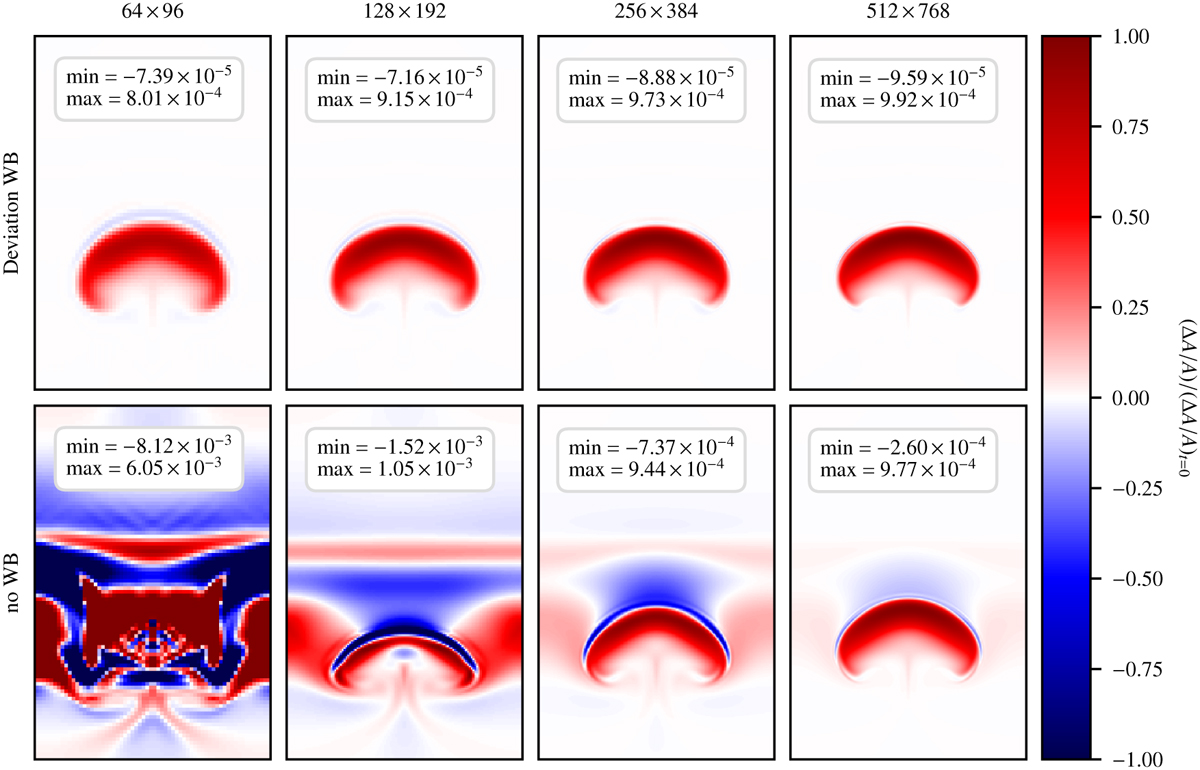
Final distribution of the entropy fluctuations of the hot bubble for (ΔA/A)t=0 = 10−3 at different grid resolutions. The entropy fluctuations are rescaled by (ΔA/A)t=0. The top row shows the results obtained with deviation well-balancing, whereas no well-balancing method was used in the simulations shown in the bottom row. The insets show the minimum and maximum values of the entropy fluctuation in each panel.
Current usage metrics show cumulative count of Article Views (full-text article views including HTML views, PDF and ePub downloads, according to the available data) and Abstracts Views on Vision4Press platform.
Data correspond to usage on the plateform after 2015. The current usage metrics is available 48-96 hours after online publication and is updated daily on week days.
Initial download of the metrics may take a while.