Fig. 5
Download original image
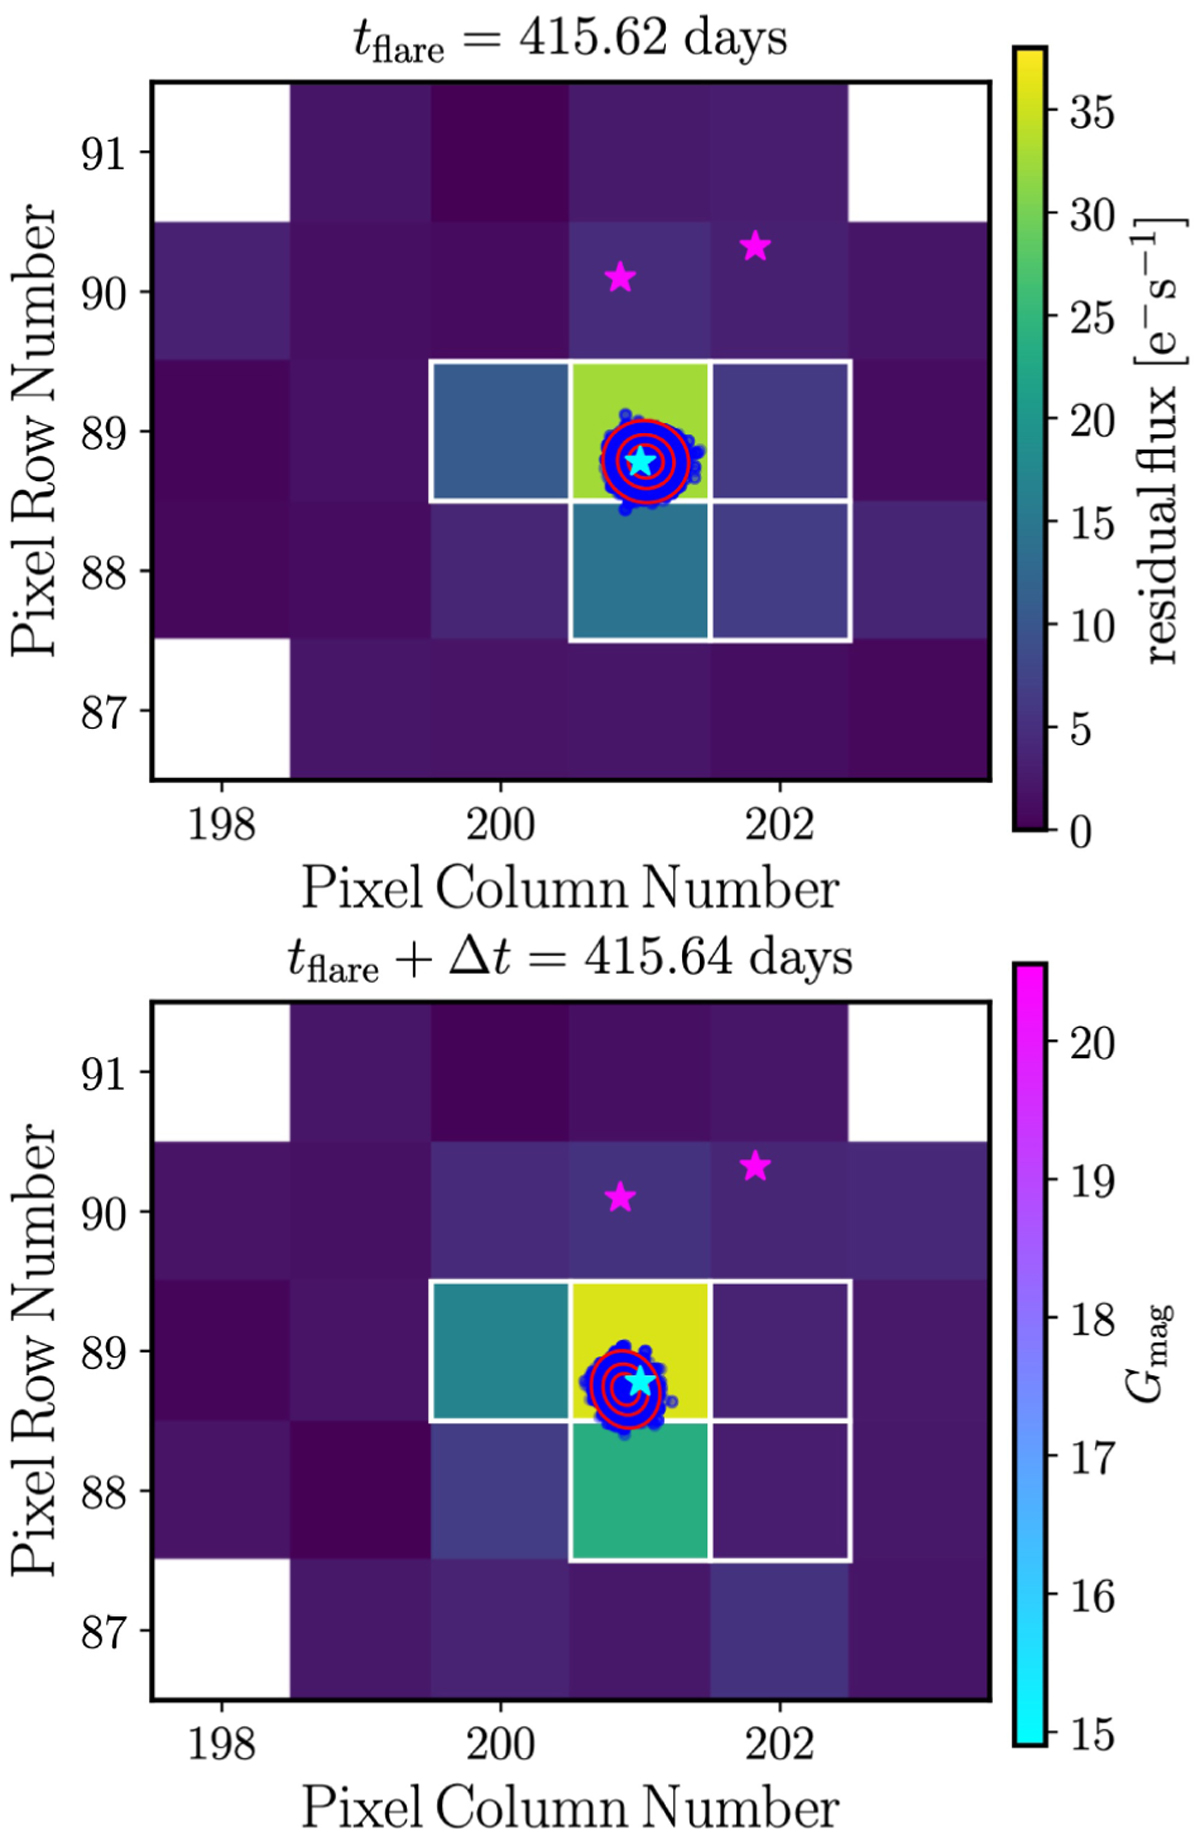
Example of flare localization in the target pixel files for two subsequent cadences tflare (top) and tflare + ∆t (bottom). The star symbols are color-coded according to their apparent Gaia magnitude Gmag. The blue dots represent 1000 realizations of the flare position obtained from the MCMC fitting, and the red ellipses show the 68%, 95%, and 99.9% confidence regions. The squares with white borders show the pixels of the aperture mask used to extract the light curve.
Current usage metrics show cumulative count of Article Views (full-text article views including HTML views, PDF and ePub downloads, according to the available data) and Abstracts Views on Vision4Press platform.
Data correspond to usage on the plateform after 2015. The current usage metrics is available 48-96 hours after online publication and is updated daily on week days.
Initial download of the metrics may take a while.