Fig. 2
Download original image
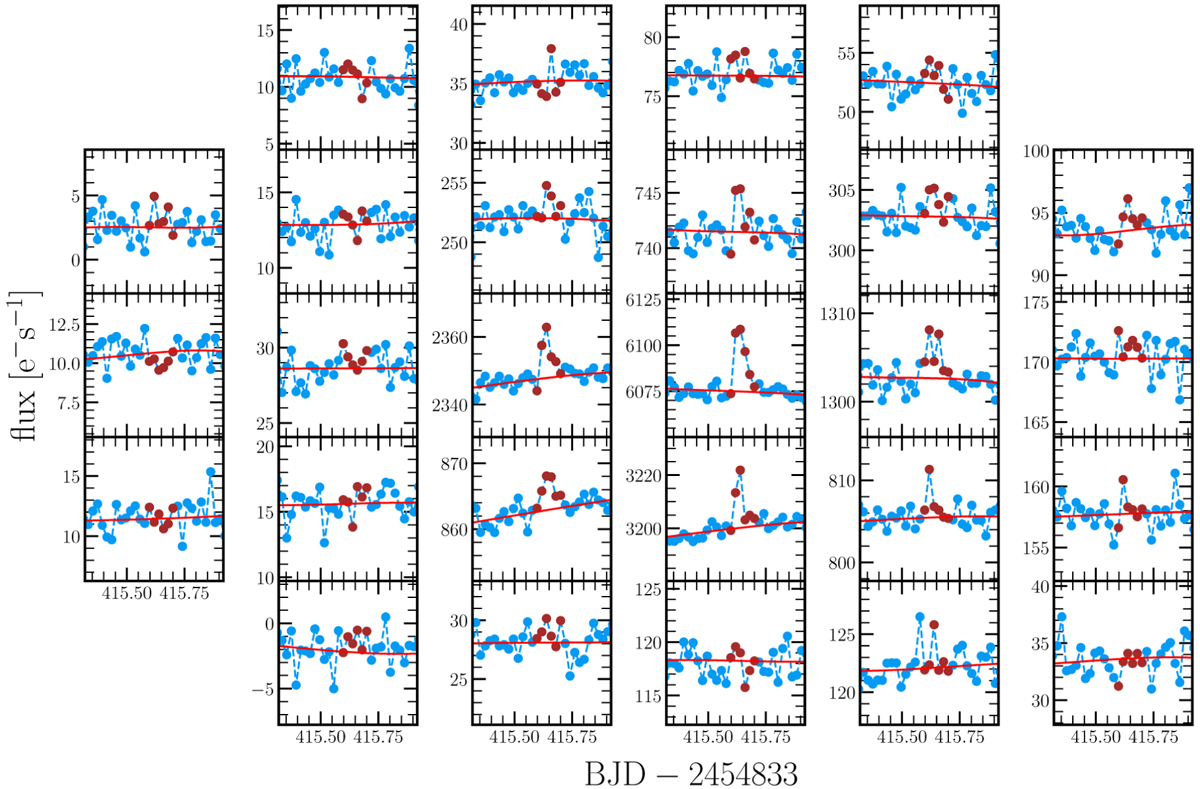
Example of flux detrending in individual pixels for the star KIC 10011070 around the flare at tflare = 415.62 days. The blue dots are data points Fp(tk) used for the model of the flux variation in the absence of the flare ![]() . The data points in all pixels at a given cadence F(tk) represent an image. The red dots indicate data during the interval tflare ≤ tk ≤ tflare + δtflare, which were excluded from the fitting of
. The data points in all pixels at a given cadence F(tk) represent an image. The red dots indicate data during the interval tflare ≤ tk ≤ tflare + δtflare, which were excluded from the fitting of ![]() . The ordinates in the individual panels are on different scales.
. The ordinates in the individual panels are on different scales.
Current usage metrics show cumulative count of Article Views (full-text article views including HTML views, PDF and ePub downloads, according to the available data) and Abstracts Views on Vision4Press platform.
Data correspond to usage on the plateform after 2015. The current usage metrics is available 48-96 hours after online publication and is updated daily on week days.
Initial download of the metrics may take a while.