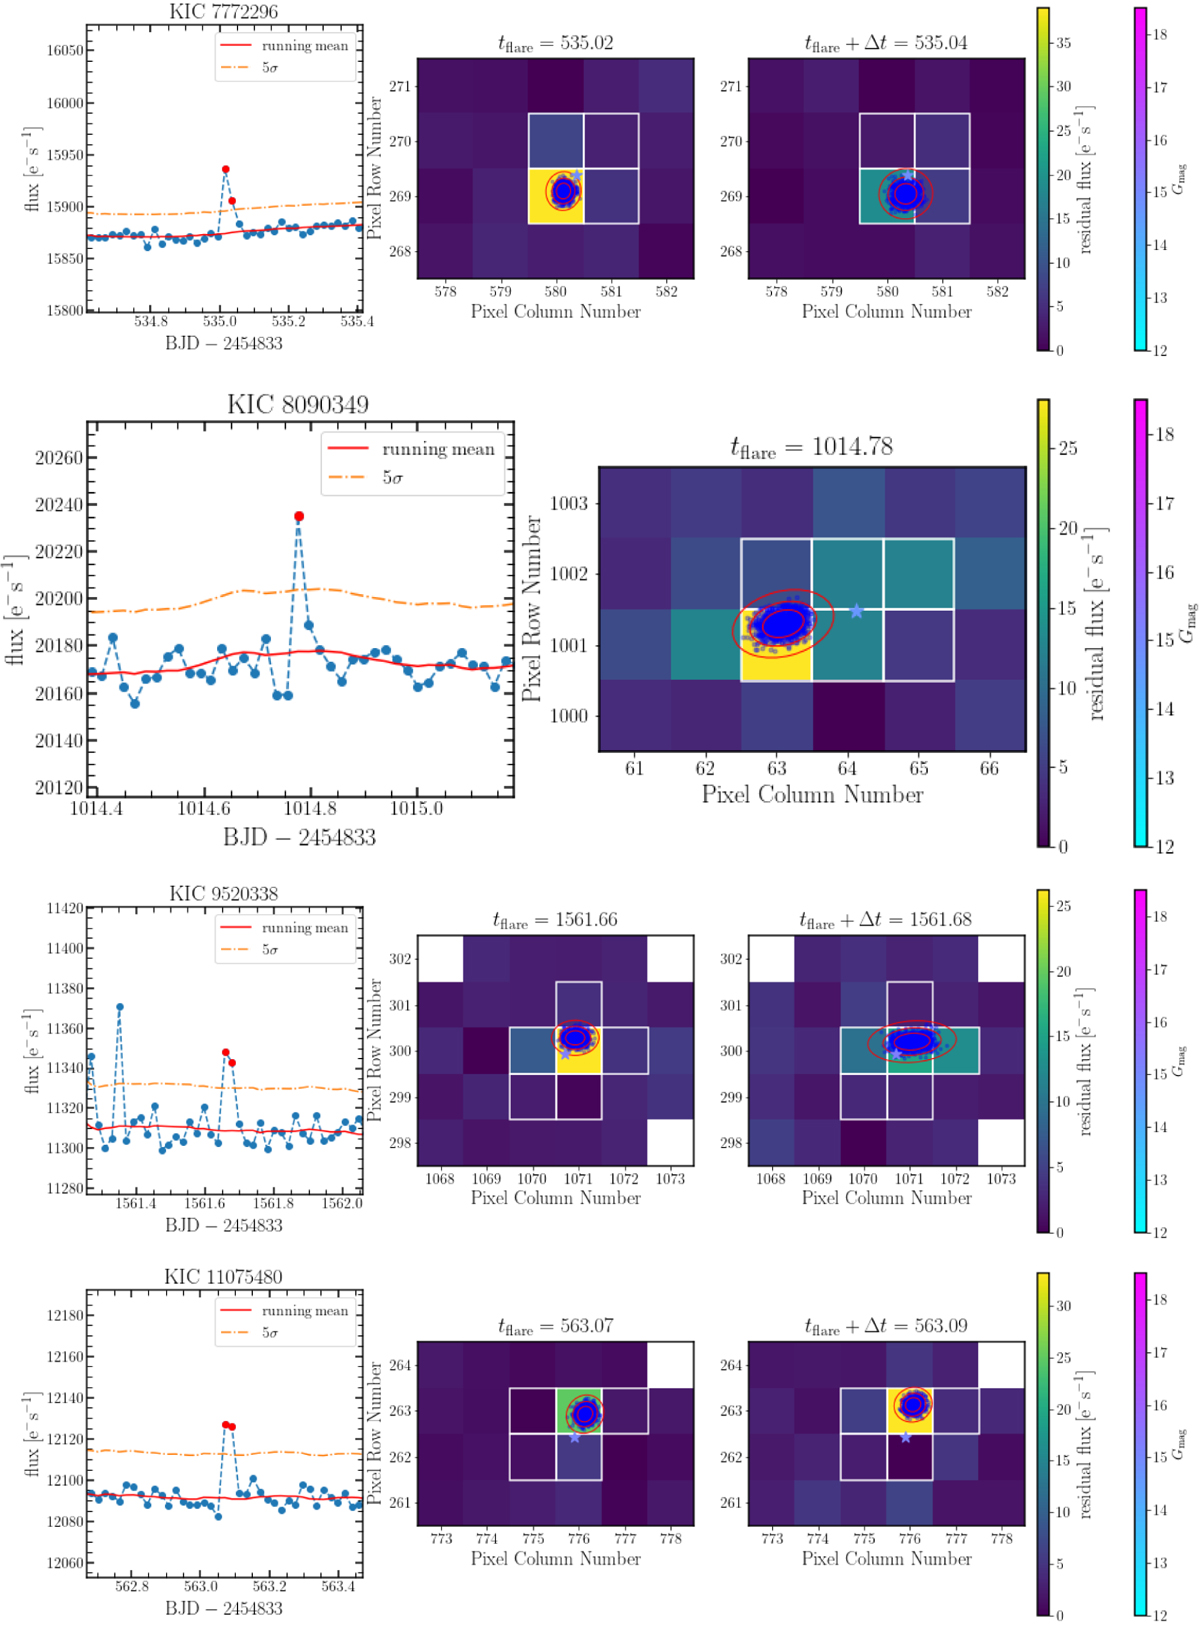
Fig. E.1
Download original image
Seven Sun-like stars with flare detections reported by Okamoto et al. (2021) rejected by our method. Left panel: Light curve with the running mean (red line) and 5σ level (dash-dotted orange line) used to find flare candidates. The red dots show the cadences (tflare and tflare + Δt) for which the PSF fitting was performed. Middle and right panels: Residual images with the flare location and the 68%, 95%, and 99.9% confidence ellipses. For events that have only one data point above the 5σ level on the light curve, we performed the PSF fitting of the flare image only for that cadence.
Current usage metrics show cumulative count of Article Views (full-text article views including HTML views, PDF and ePub downloads, according to the available data) and Abstracts Views on Vision4Press platform.
Data correspond to usage on the plateform after 2015. The current usage metrics is available 48-96 hours after online publication and is updated daily on week days.
Initial download of the metrics may take a while.