Fig. 1
Download original image
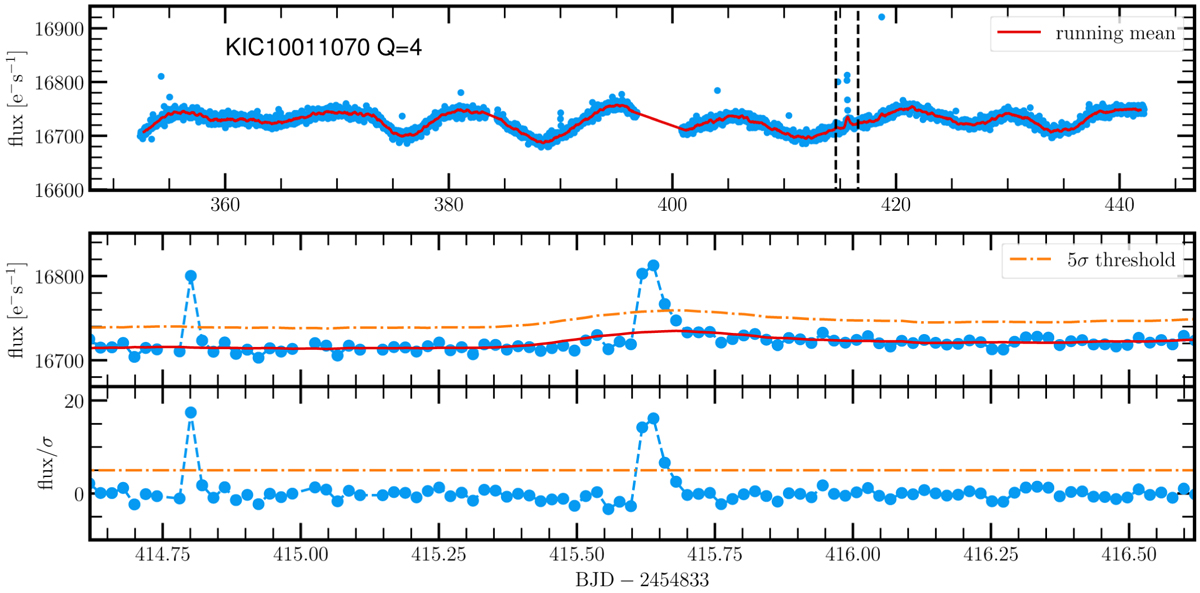
Flare candidate detection in the light curve of star KIC 10011070 observed in quarter Q = 4. Top panel: original light curve (blue dots) and running mean (red line) calculated with a boxcar function averaging over 15 cadences. The vertical dashed lines indicate a period around a potential flare. Middle panel: zoom-in on the period around the flare candidate indicated in the top panel. The running mean is shown as a solid red line and the running 5σ threshold as a dash-dotted orange line. Bottom panel: detrended time series obtained by subtracting the running mean and normalizing by the standard deviation σ. The three consecutive data points in the middle clearly exceed the 5σ threshold.
Current usage metrics show cumulative count of Article Views (full-text article views including HTML views, PDF and ePub downloads, according to the available data) and Abstracts Views on Vision4Press platform.
Data correspond to usage on the plateform after 2015. The current usage metrics is available 48-96 hours after online publication and is updated daily on week days.
Initial download of the metrics may take a while.