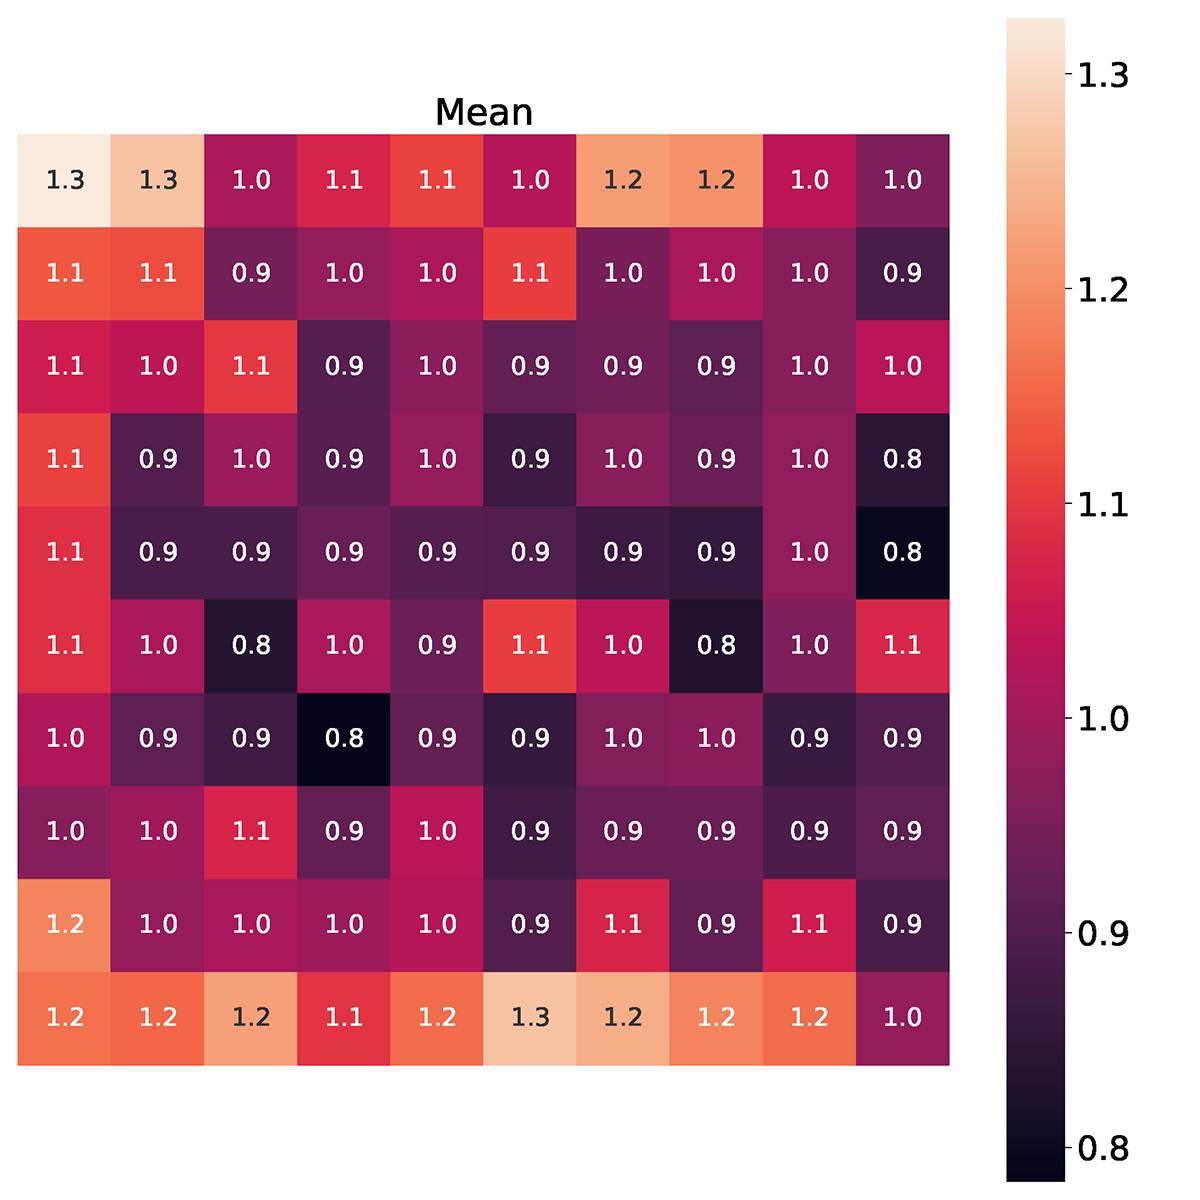
Fig. 7.
Download original image
Heat-map for the normalized mean number of times that each cell in the mosaic was clicked on, among all seven visual inspectors during phase 1 of the visual inspection. The values in each cell were obtained by calculating the mean of the total number of clicks per-cell among the seven users; we normalized these values by a factor of 24.78 that represents the mean number of clicks in a cell for this specific classification.
Current usage metrics show cumulative count of Article Views (full-text article views including HTML views, PDF and ePub downloads, according to the available data) and Abstracts Views on Vision4Press platform.
Data correspond to usage on the plateform after 2015. The current usage metrics is available 48-96 hours after online publication and is updated daily on week days.
Initial download of the metrics may take a while.