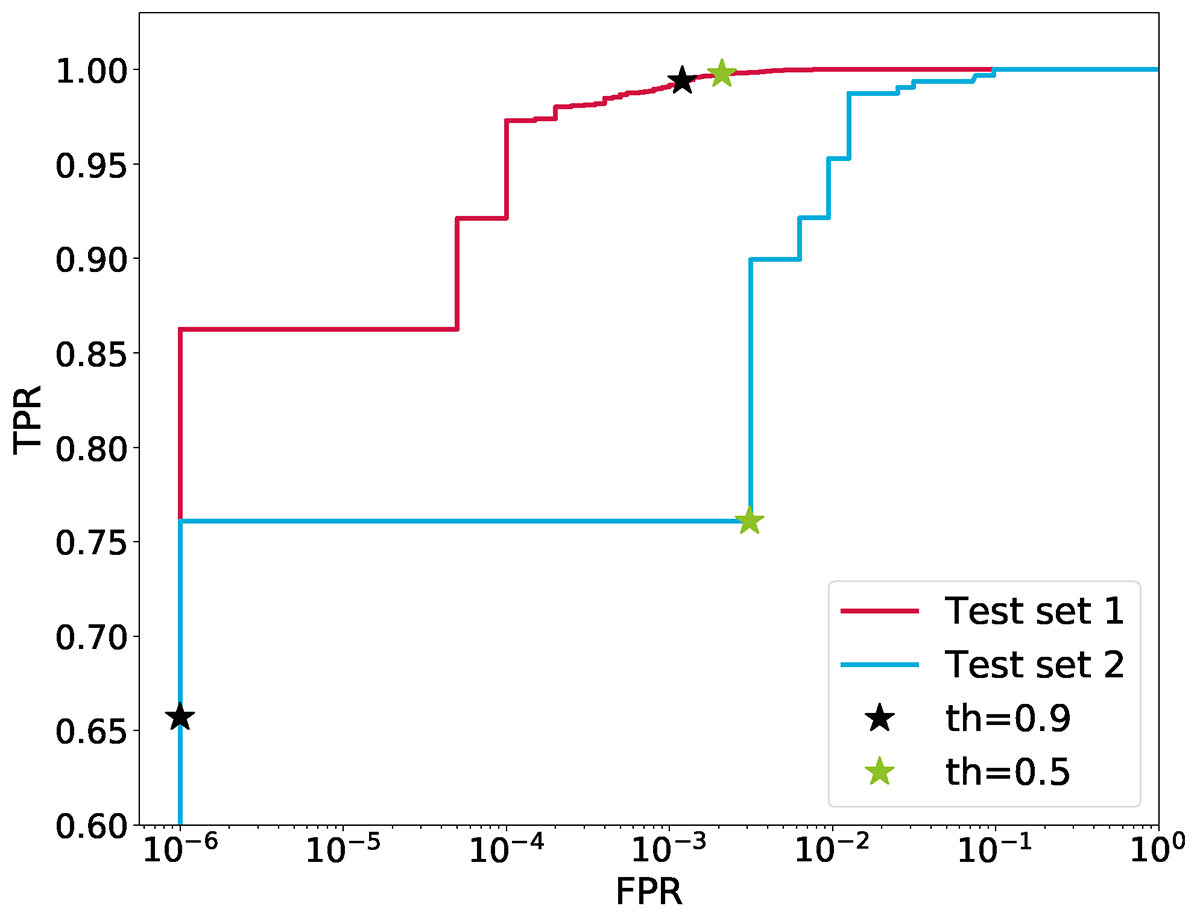
Fig. 6.
Download original image
ROC curve for the test set containing simulations (test set 1 in red) along with the confirmed and candidate lenses (test set 2 in blue); both datasets contain real LRGs as non-lensed examples. The FPR is plotted on a logarithmic scale to aid visualization. The TPR and FPR for SCNN = 0.5 (green) and SCNN = 0.9 (black) are also shown for each set.
Current usage metrics show cumulative count of Article Views (full-text article views including HTML views, PDF and ePub downloads, according to the available data) and Abstracts Views on Vision4Press platform.
Data correspond to usage on the plateform after 2015. The current usage metrics is available 48-96 hours after online publication and is updated daily on week days.
Initial download of the metrics may take a while.