Fig. 5.
Download original image
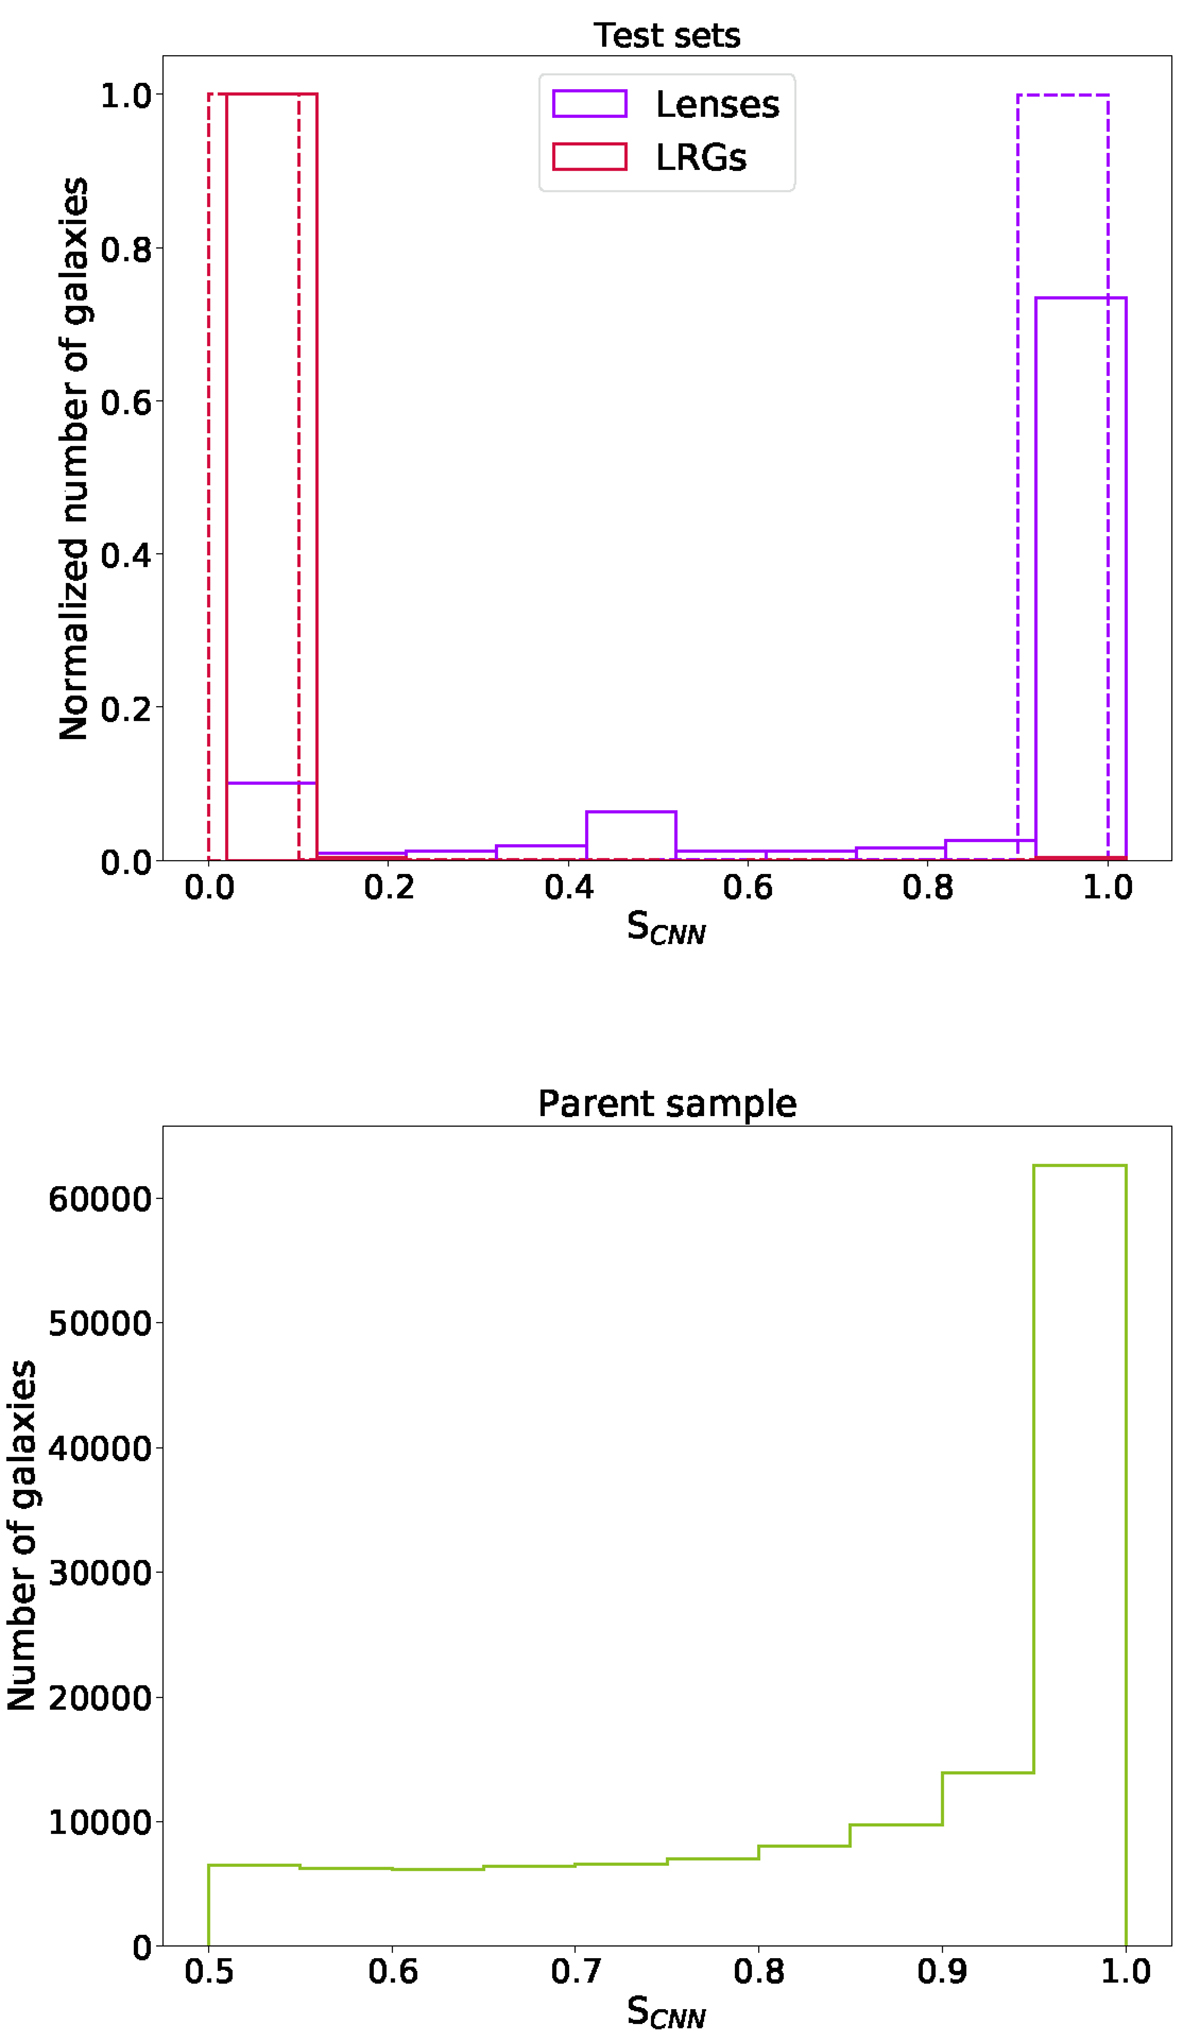
CNN score (SCNN) distribution for the different datasets. Top panel: SCNN distribution of both test sets: lens simulations (dashed line) and real confirmed and candidate lenses (solid line). Both datasets contain images labeled as lenses (purple lines) and real LRGs labeled as non-lenses (red lines). The two test-sets are normalized to their corresponding maximum value in the distribution. We shifted the x-axis of the second test set distribution by 0.02 for clarity. Bottom panel: SCNN distribution for the objects in the parent sample with scores above 0.5. We crop the x-axis for visualization as 99% of the sample is below 0.5.
Current usage metrics show cumulative count of Article Views (full-text article views including HTML views, PDF and ePub downloads, according to the available data) and Abstracts Views on Vision4Press platform.
Data correspond to usage on the plateform after 2015. The current usage metrics is available 48-96 hours after online publication and is updated daily on week days.
Initial download of the metrics may take a while.