Fig. 2.
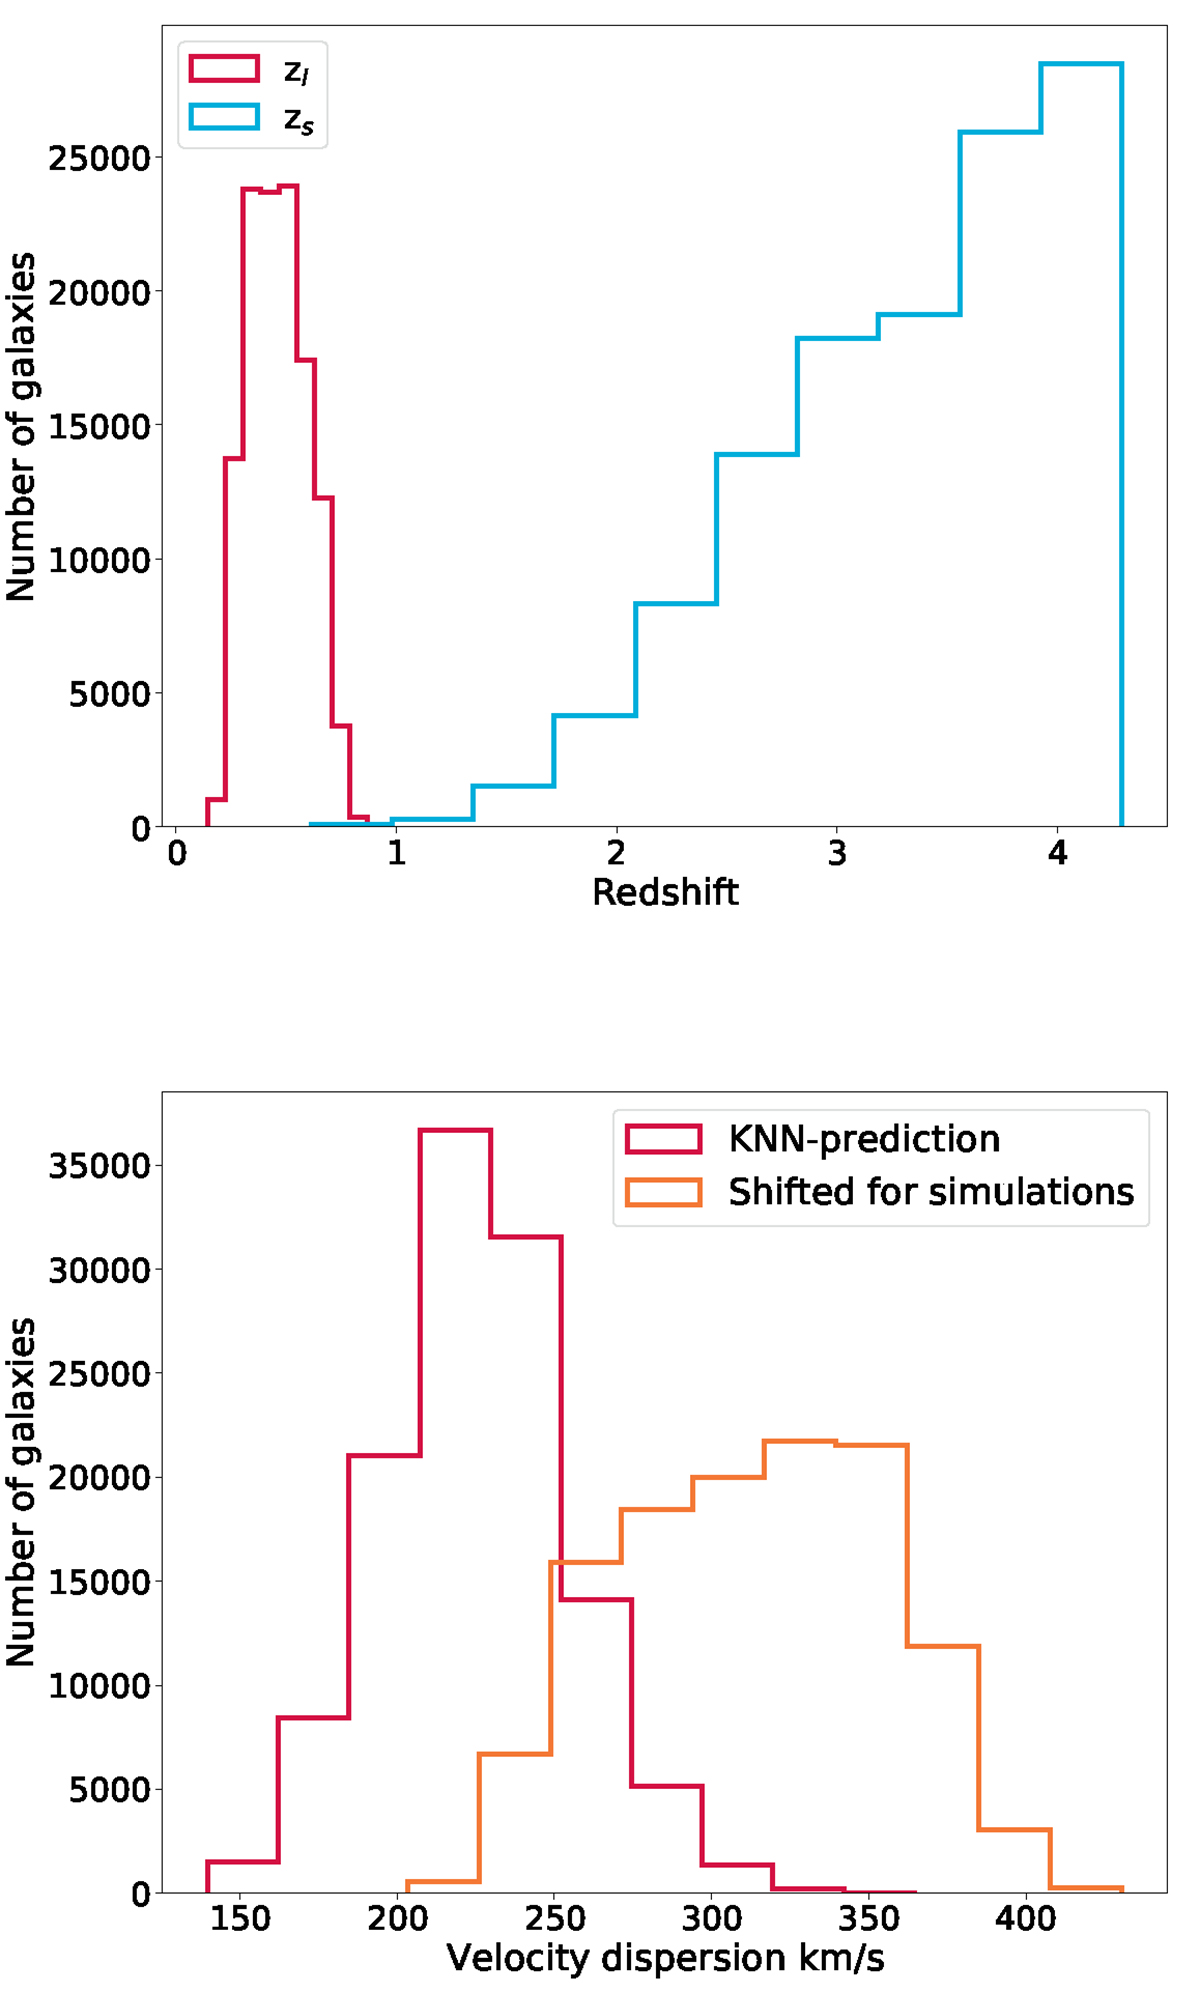
Download original image
Redshifts and velocity dispersion distributions used for simulations. Top panel: redshift distributions of the lenses (red) and sources (blue) in the simulated training set. Bottom panel: lens velocity-dispersion distribution, predicted from the K-nearest neighbor algorithm (red) and shifted to match the criteria of pairing lenses and sources (orange), as described in Sect. 3.2. We note that the actual lens velocity dispersions used in the simulations are shifted to higher values, so that lensing features can be seen even at the DES resolution.
Current usage metrics show cumulative count of Article Views (full-text article views including HTML views, PDF and ePub downloads, according to the available data) and Abstracts Views on Vision4Press platform.
Data correspond to usage on the plateform after 2015. The current usage metrics is available 48-96 hours after online publication and is updated daily on week days.
Initial download of the metrics may take a while.