Fig. B.1.
Download original image
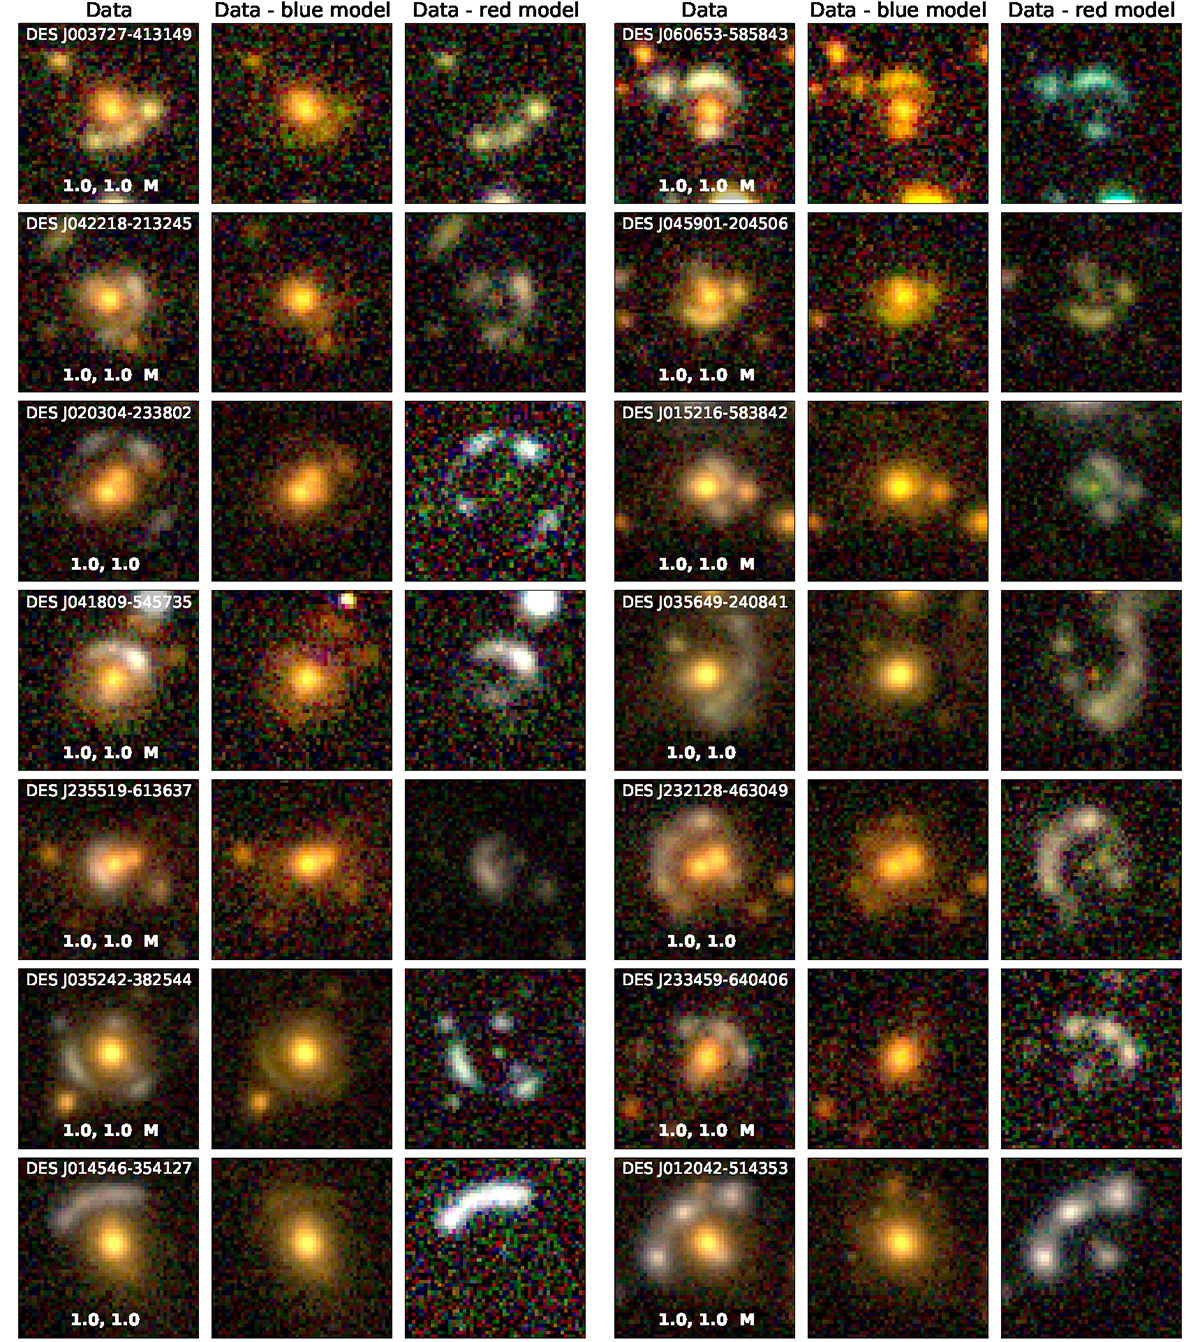
Images for the 90 lens candidates in the category Sure lens and their corresponding decomposition performed with MuSCADeT. In the first and fourth columns we have the gri-composite image of the system, the name is on the top, while the CNN score and the visual inspection score (VISL) are displayed at the bottom of each image. Additionally, we marked with an "M" those that we modeled in Sect. 6. Columns 2 and 5 show the subtraction of the blue model from the respective data. Columns 3 and 6 show the subtraction of the red model from the respective data, isolating the lensing features.
Current usage metrics show cumulative count of Article Views (full-text article views including HTML views, PDF and ePub downloads, according to the available data) and Abstracts Views on Vision4Press platform.
Data correspond to usage on the plateform after 2015. The current usage metrics is available 48-96 hours after online publication and is updated daily on week days.
Initial download of the metrics may take a while.