Fig. 13.
Download original image
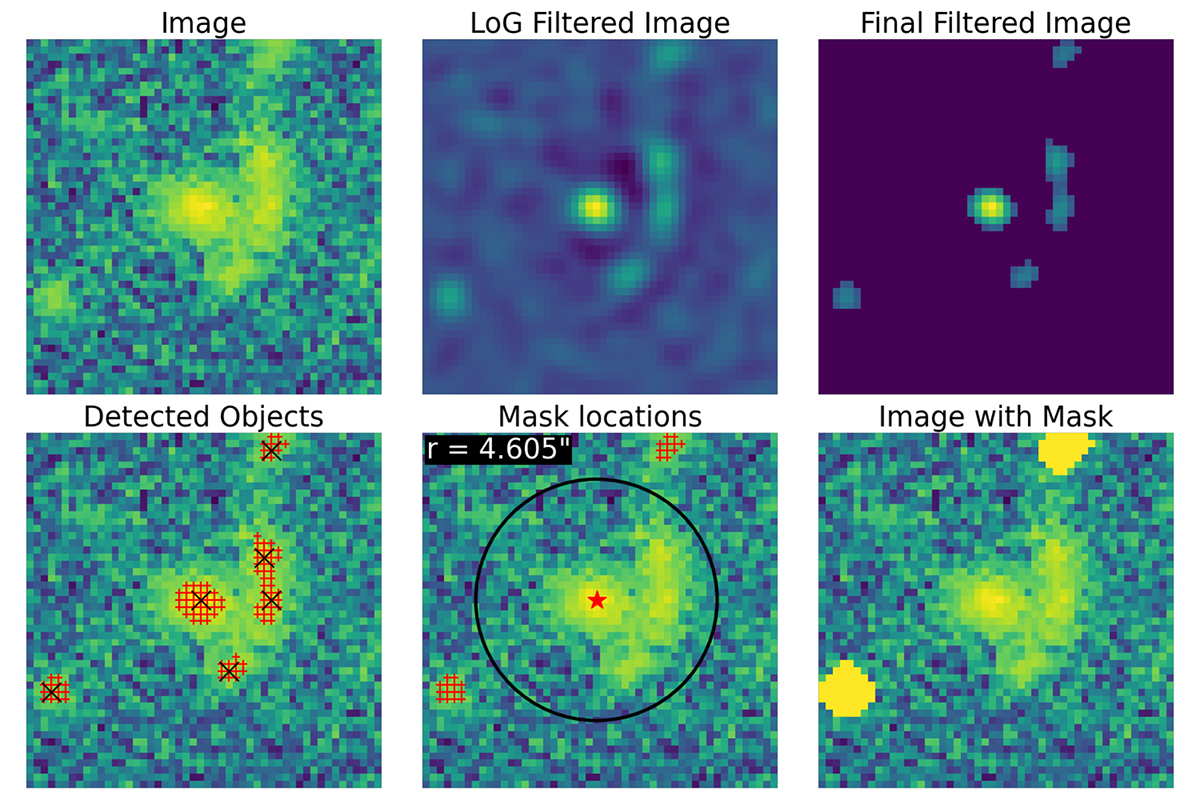
Illustration of the automated masking procedure using an example DES image. In the upper row, we show (from left to right) the original image, the image after applying an LoG filter, and the result of setting pixels with flux below the threshold to zero. In the bottom row we show in the leftmost frame the original image annotated with the remaining pixels from the filtering step (red “+” marks), along with the detected peaks (black “x” marks). In the middle we show the estimated size of the lens system with a black circle, as well as the detected bright pixels that are considered contaminant light. These pixels are then used for the mask, and we show the areas covered in the rightmost panel by setting the corresponding pixels to a large constant value.
Current usage metrics show cumulative count of Article Views (full-text article views including HTML views, PDF and ePub downloads, according to the available data) and Abstracts Views on Vision4Press platform.
Data correspond to usage on the plateform after 2015. The current usage metrics is available 48-96 hours after online publication and is updated daily on week days.
Initial download of the metrics may take a while.