Fig. 11.
Download original image
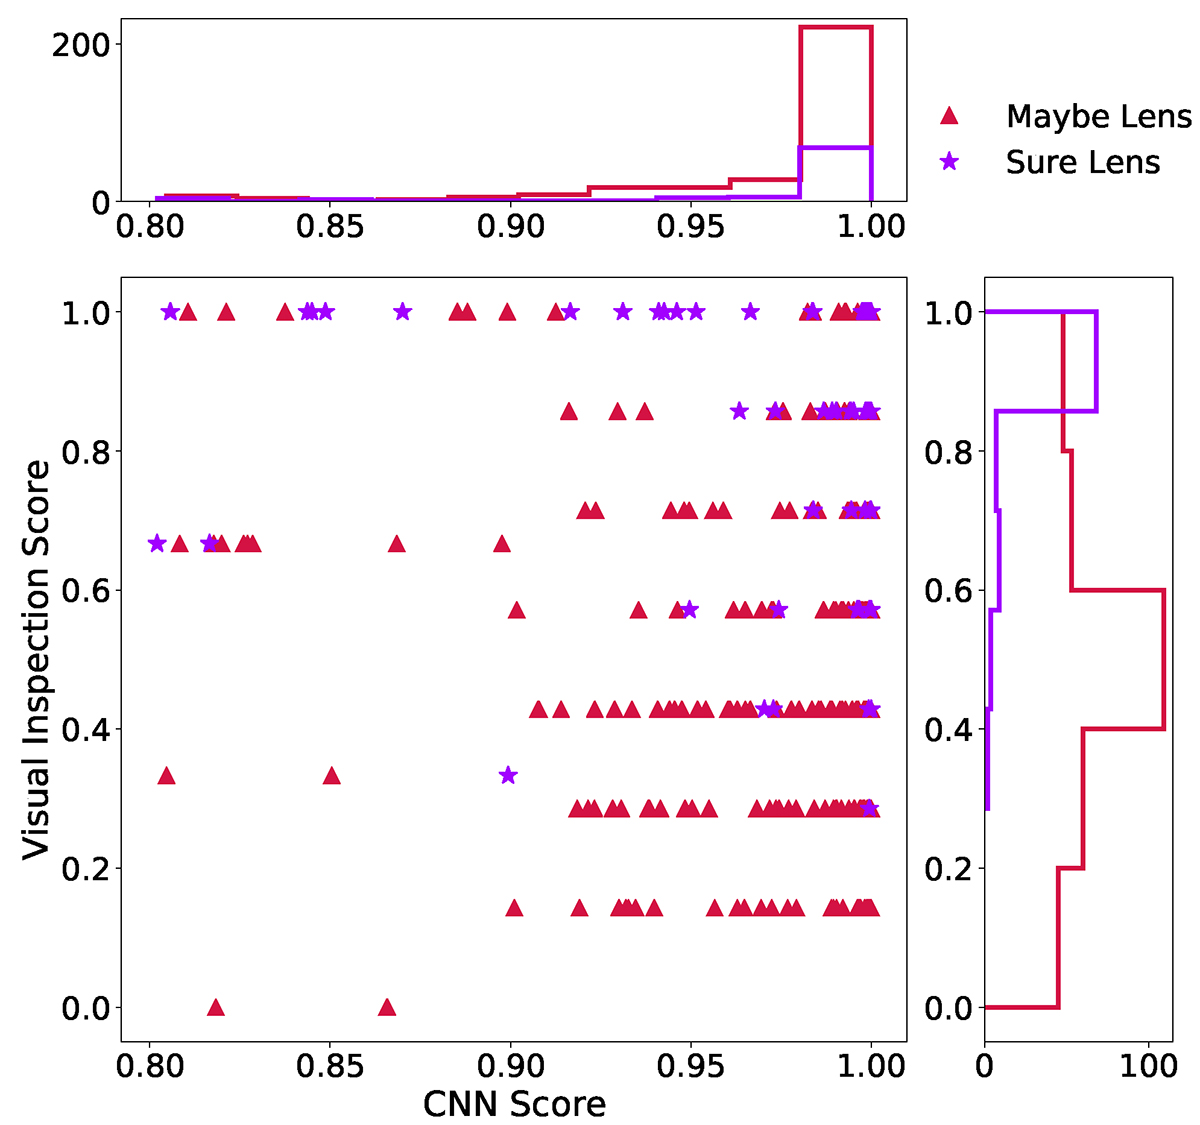
CNN score (SCNN) against the visual inspection score (VISL), with their respective distributions for the final catalog of lens candidates containing 405 systems. The distribution of the category “sure lens” is in purple and “maybe lens” is in red, while in the scatter plot “sure lens” systems are represented by stars and “maybe lens” systems by triangles.
Current usage metrics show cumulative count of Article Views (full-text article views including HTML views, PDF and ePub downloads, according to the available data) and Abstracts Views on Vision4Press platform.
Data correspond to usage on the plateform after 2015. The current usage metrics is available 48-96 hours after online publication and is updated daily on week days.
Initial download of the metrics may take a while.