Fig. 10.
Download original image
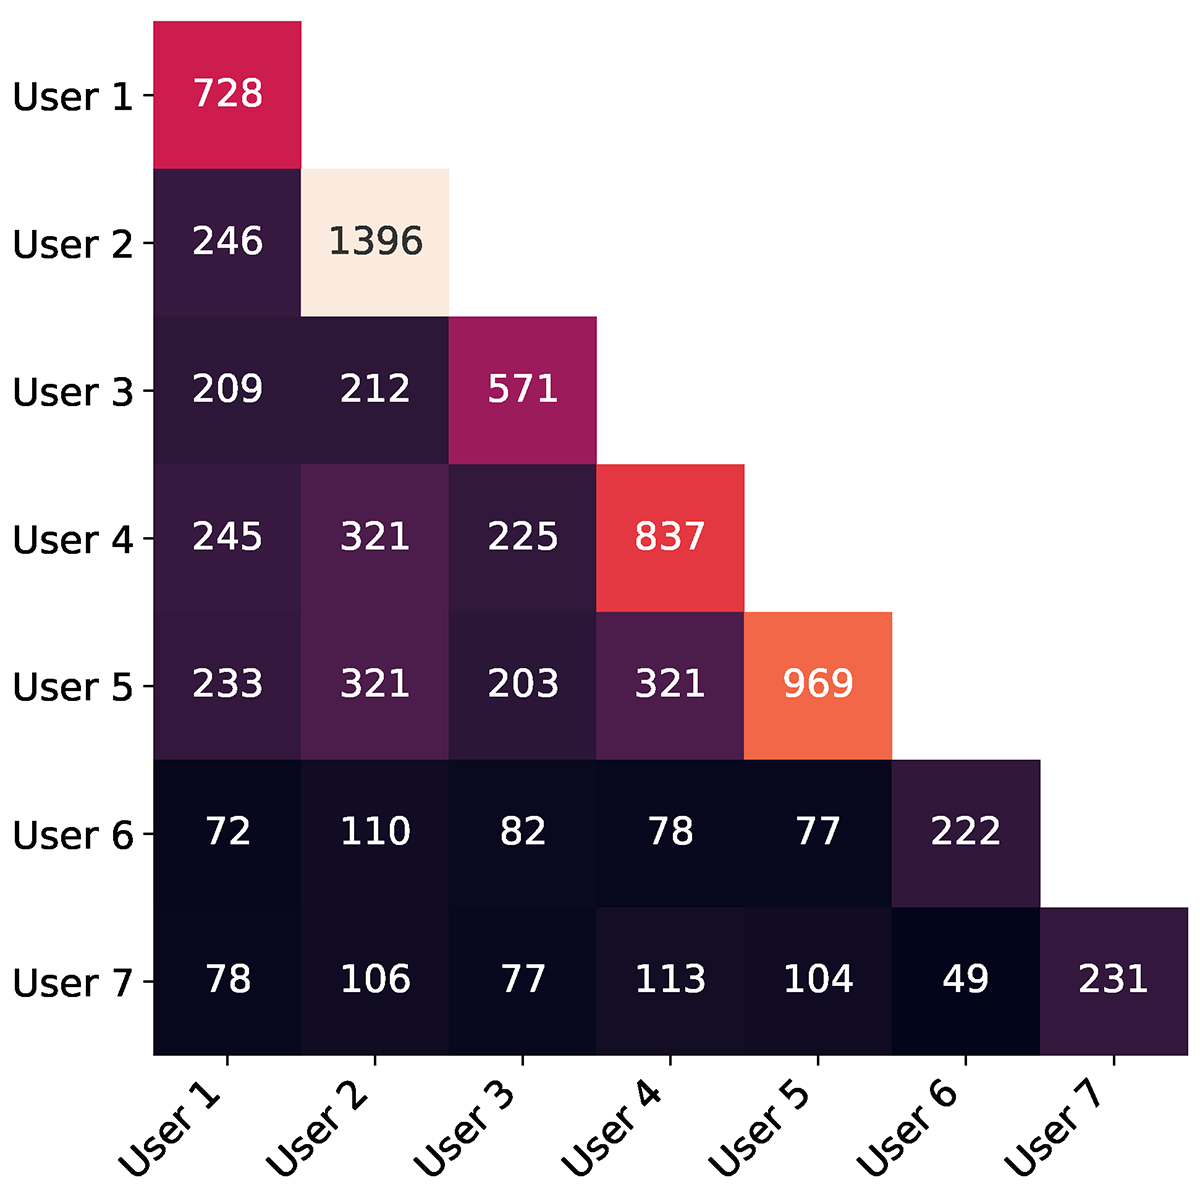
Correlation among different classifiers for the categories “sure lens” and “maybe lens” after phase 3. The values in the diagonal represent the total number of objects classified into both categories for each user, while in the adjacent rows and columns the number of objects that both users classified into the same category.
Current usage metrics show cumulative count of Article Views (full-text article views including HTML views, PDF and ePub downloads, according to the available data) and Abstracts Views on Vision4Press platform.
Data correspond to usage on the plateform after 2015. The current usage metrics is available 48-96 hours after online publication and is updated daily on week days.
Initial download of the metrics may take a while.