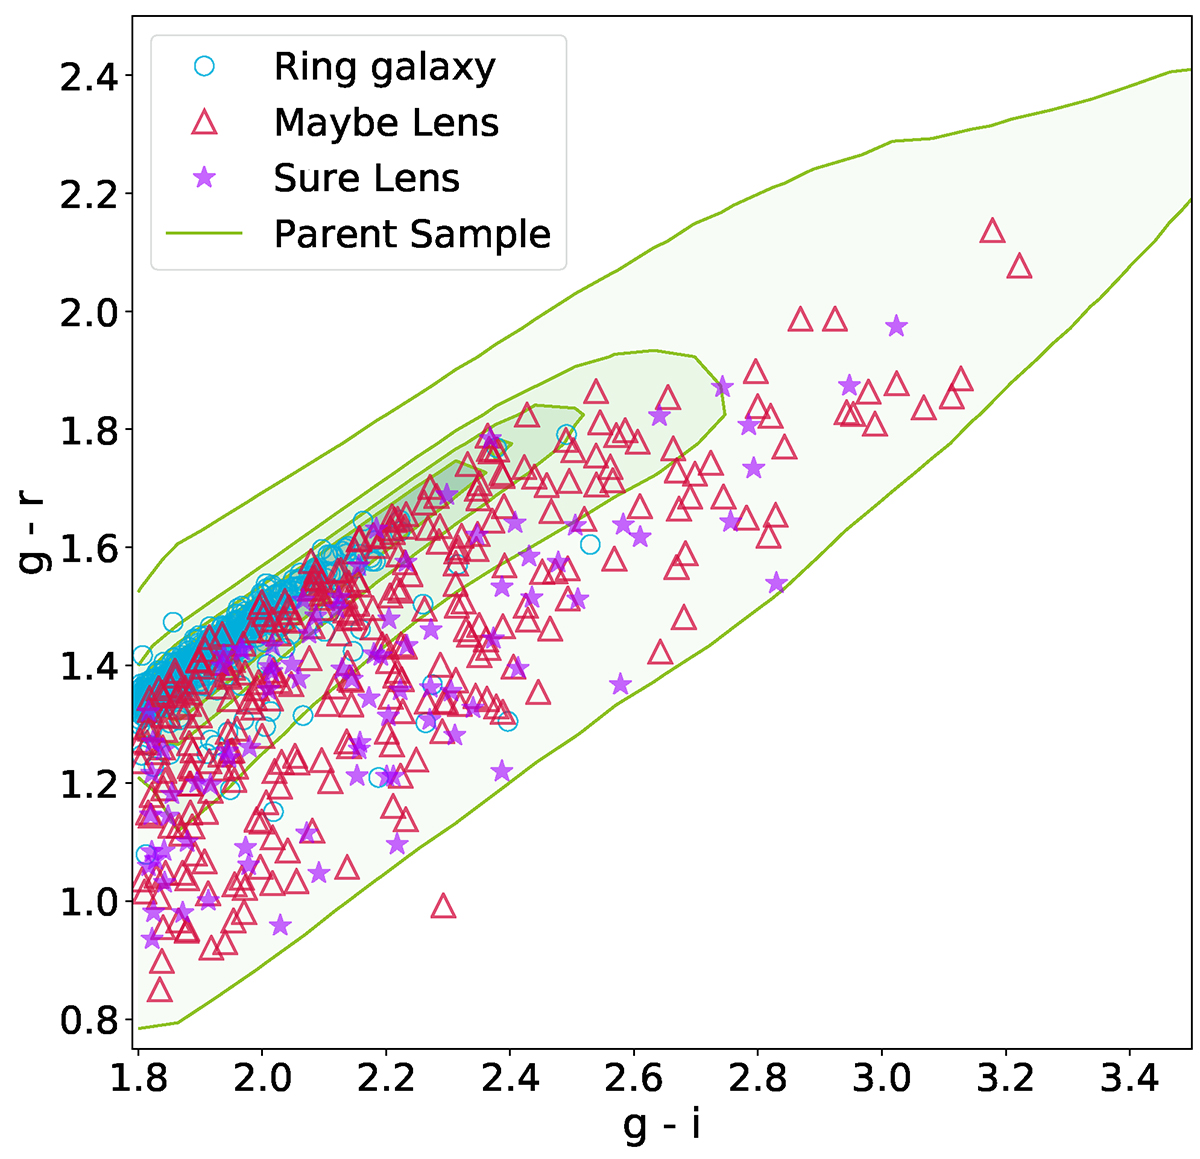
Fig. 1.
Download original image
Color-color diagram of our parent sample of ∼19 million galaxies. The plot displays where most galaxies in our selection are located. The green shaded area shows the density of galaxies from the parent LRG sample. The green solid lines shows the 1, 2, 3, and 6σ contours. The lens candidates and contaminants from this work are shown in overlay: Sure Lens (purple stars), Maybe Lens (open red triangles), and ring galaxies (open cyan circles). See Sect. 5.3 for details.
Current usage metrics show cumulative count of Article Views (full-text article views including HTML views, PDF and ePub downloads, according to the available data) and Abstracts Views on Vision4Press platform.
Data correspond to usage on the plateform after 2015. The current usage metrics is available 48-96 hours after online publication and is updated daily on week days.
Initial download of the metrics may take a while.