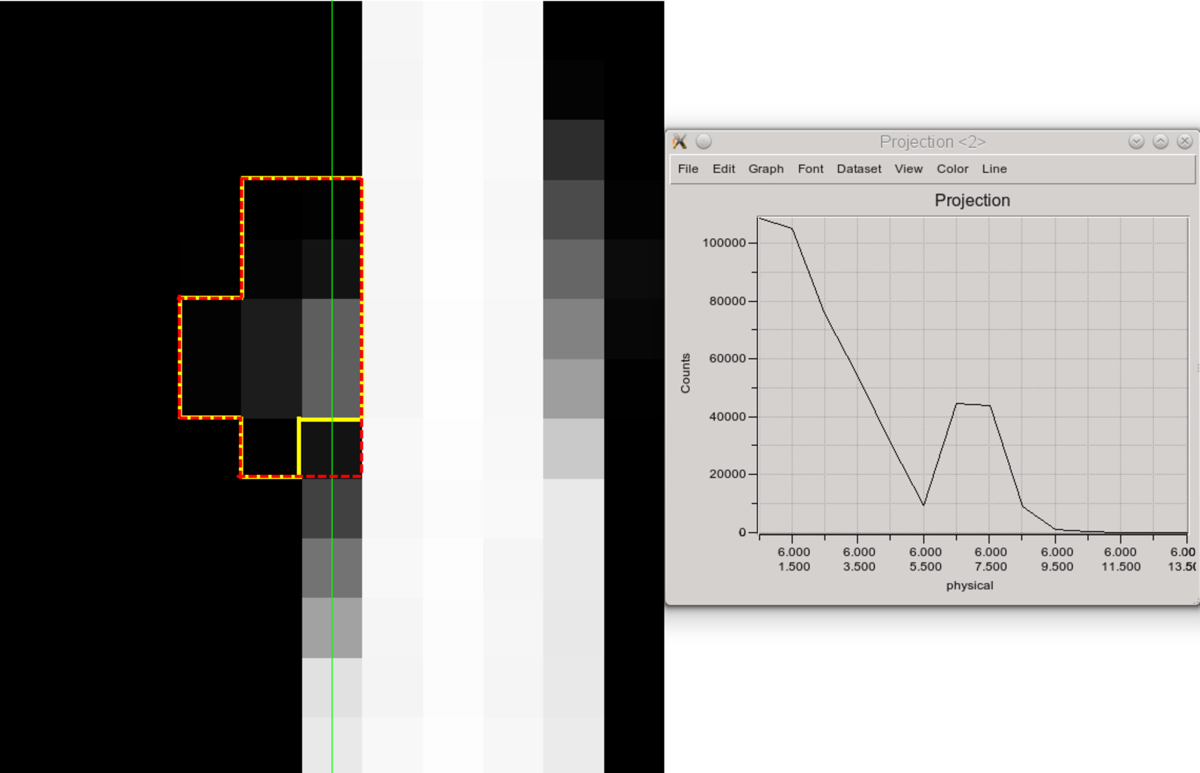
Fig. B.1.
Download original image
Single frame of the TESS target pixel file with the pipeline mask shown as a dashed red line. The so-called bleed trail of γ Leo contaminates the flux of AD Leo. The graph on the right shows the projection of the pixel column with the strongest contamination (shown as the green line in the TPF). We applied our own light-curve extraction using a customized mask (solid yellow line) and corrected the flux level of the second strongest contaminated pixel (see text).
Current usage metrics show cumulative count of Article Views (full-text article views including HTML views, PDF and ePub downloads, according to the available data) and Abstracts Views on Vision4Press platform.
Data correspond to usage on the plateform after 2015. The current usage metrics is available 48-96 hours after online publication and is updated daily on week days.
Initial download of the metrics may take a while.