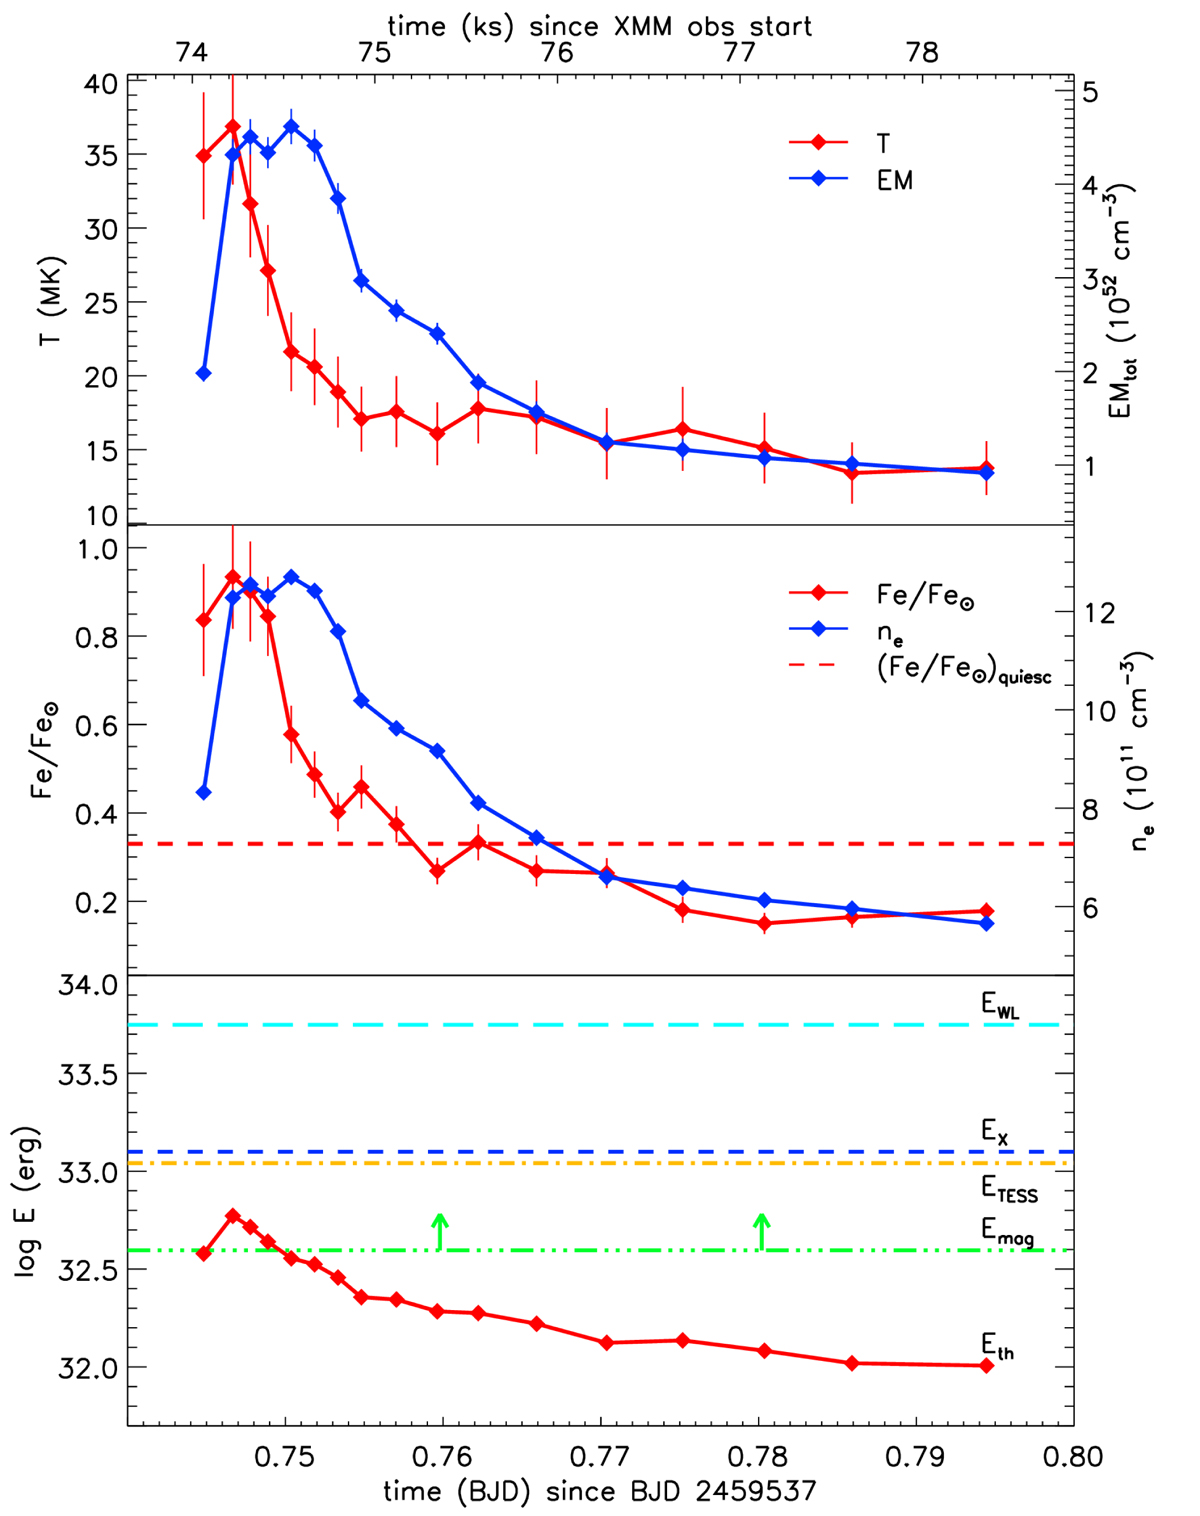
Fig. 2.
Download original image
Time evolution throughout the superflare for parameters derived from the XMM-Newton and TESS data. Upper panel: flaring plasma temperature and EM. Middle panel: flaring plasma abundances and electron density. The abundances of all elements are tied to the Fe abundance using the ratios determined for the quiescent state from the RGS spectrum that are listed in Table C.1. Lower panel: thermal energy in the flaring plasma, compared with the total radiated energy in the X-ray and optical bands.
Current usage metrics show cumulative count of Article Views (full-text article views including HTML views, PDF and ePub downloads, according to the available data) and Abstracts Views on Vision4Press platform.
Data correspond to usage on the plateform after 2015. The current usage metrics is available 48-96 hours after online publication and is updated daily on week days.
Initial download of the metrics may take a while.