Fig. 1.
Download original image
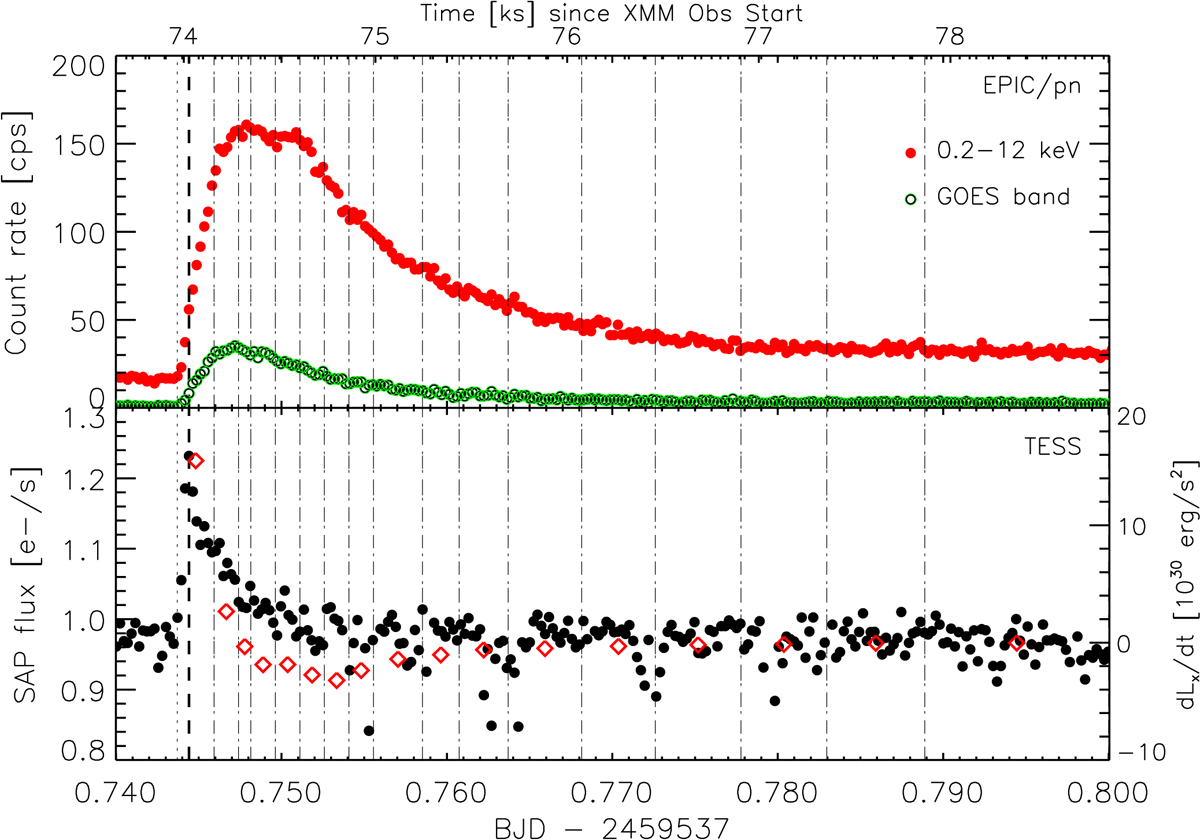
Light curves of the superflare. Top panel: XMM-Newton EPIC/pn count rate in 0.2 − 12 keV (red) and in the GOES band (1.5 − 12.4 keV; green). The binning adapted to the TESS light curve in FAST cadence (20 s) is shown in the bottom panel (black circles), where it is overlaid with the time derivative of the X-ray luminosity (open diamonds). The thick dashed vertical line marks the time of the peak of the flare flux in the TESS light curve, and the dash-dotted lines mark the boundaries of the intervals used for the time-resolved spectral analysis of the X-ray data. For a better display of the main flare phase, a cut has been set to the abscissa values such that the tail of the flare is not shown.
Current usage metrics show cumulative count of Article Views (full-text article views including HTML views, PDF and ePub downloads, according to the available data) and Abstracts Views on Vision4Press platform.
Data correspond to usage on the plateform after 2015. The current usage metrics is available 48-96 hours after online publication and is updated daily on week days.
Initial download of the metrics may take a while.