Fig. 6.
Download original image
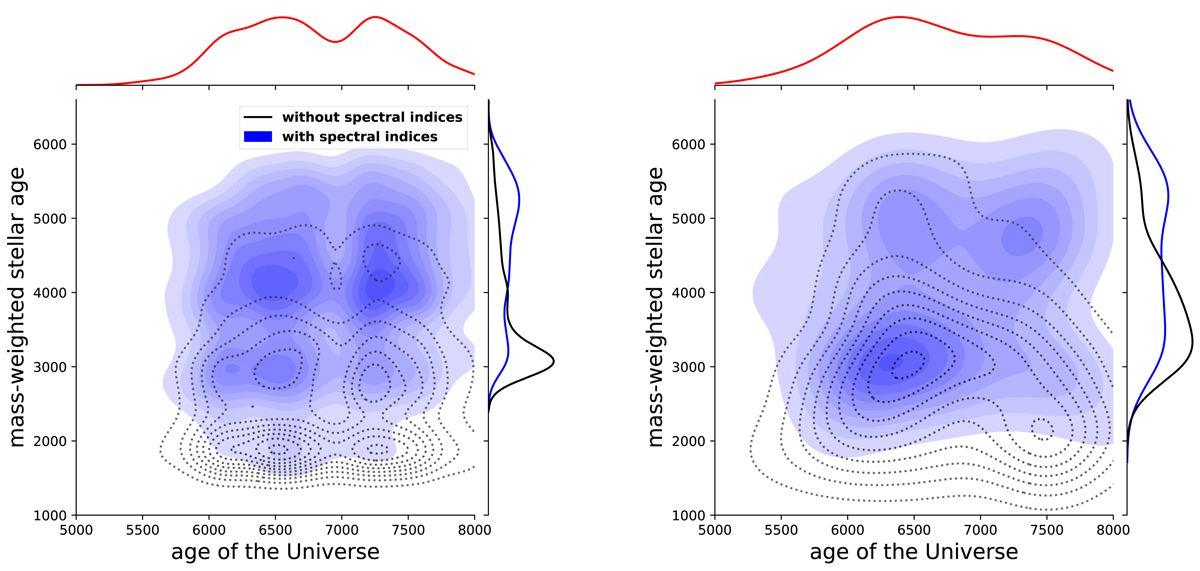
Comparison of mass-weighted stellar ages (in million years) calculated by CIGALE, with (blue shaded contours) and without (black line contours) using Hδ and Dn4000 in the fitting process, for sources in the reference catalogue (left panel) and AGNs (right panel). The addition of the two indices in the SED fitting provides additional constraints on the stellar population and allows CIGALE to calculate, on average, more meaningful stellar ages, in the sense that the distributions of the mass-weighted stellar age are flatter and better resemble the distribution of the age of the Universe, as compared to the highly peaked (at low values) and mass-weighted stellar age distributions without the spectral indices.
Current usage metrics show cumulative count of Article Views (full-text article views including HTML views, PDF and ePub downloads, according to the available data) and Abstracts Views on Vision4Press platform.
Data correspond to usage on the plateform after 2015. The current usage metrics is available 48-96 hours after online publication and is updated daily on week days.
Initial download of the metrics may take a while.