Fig. 10.
Download original image
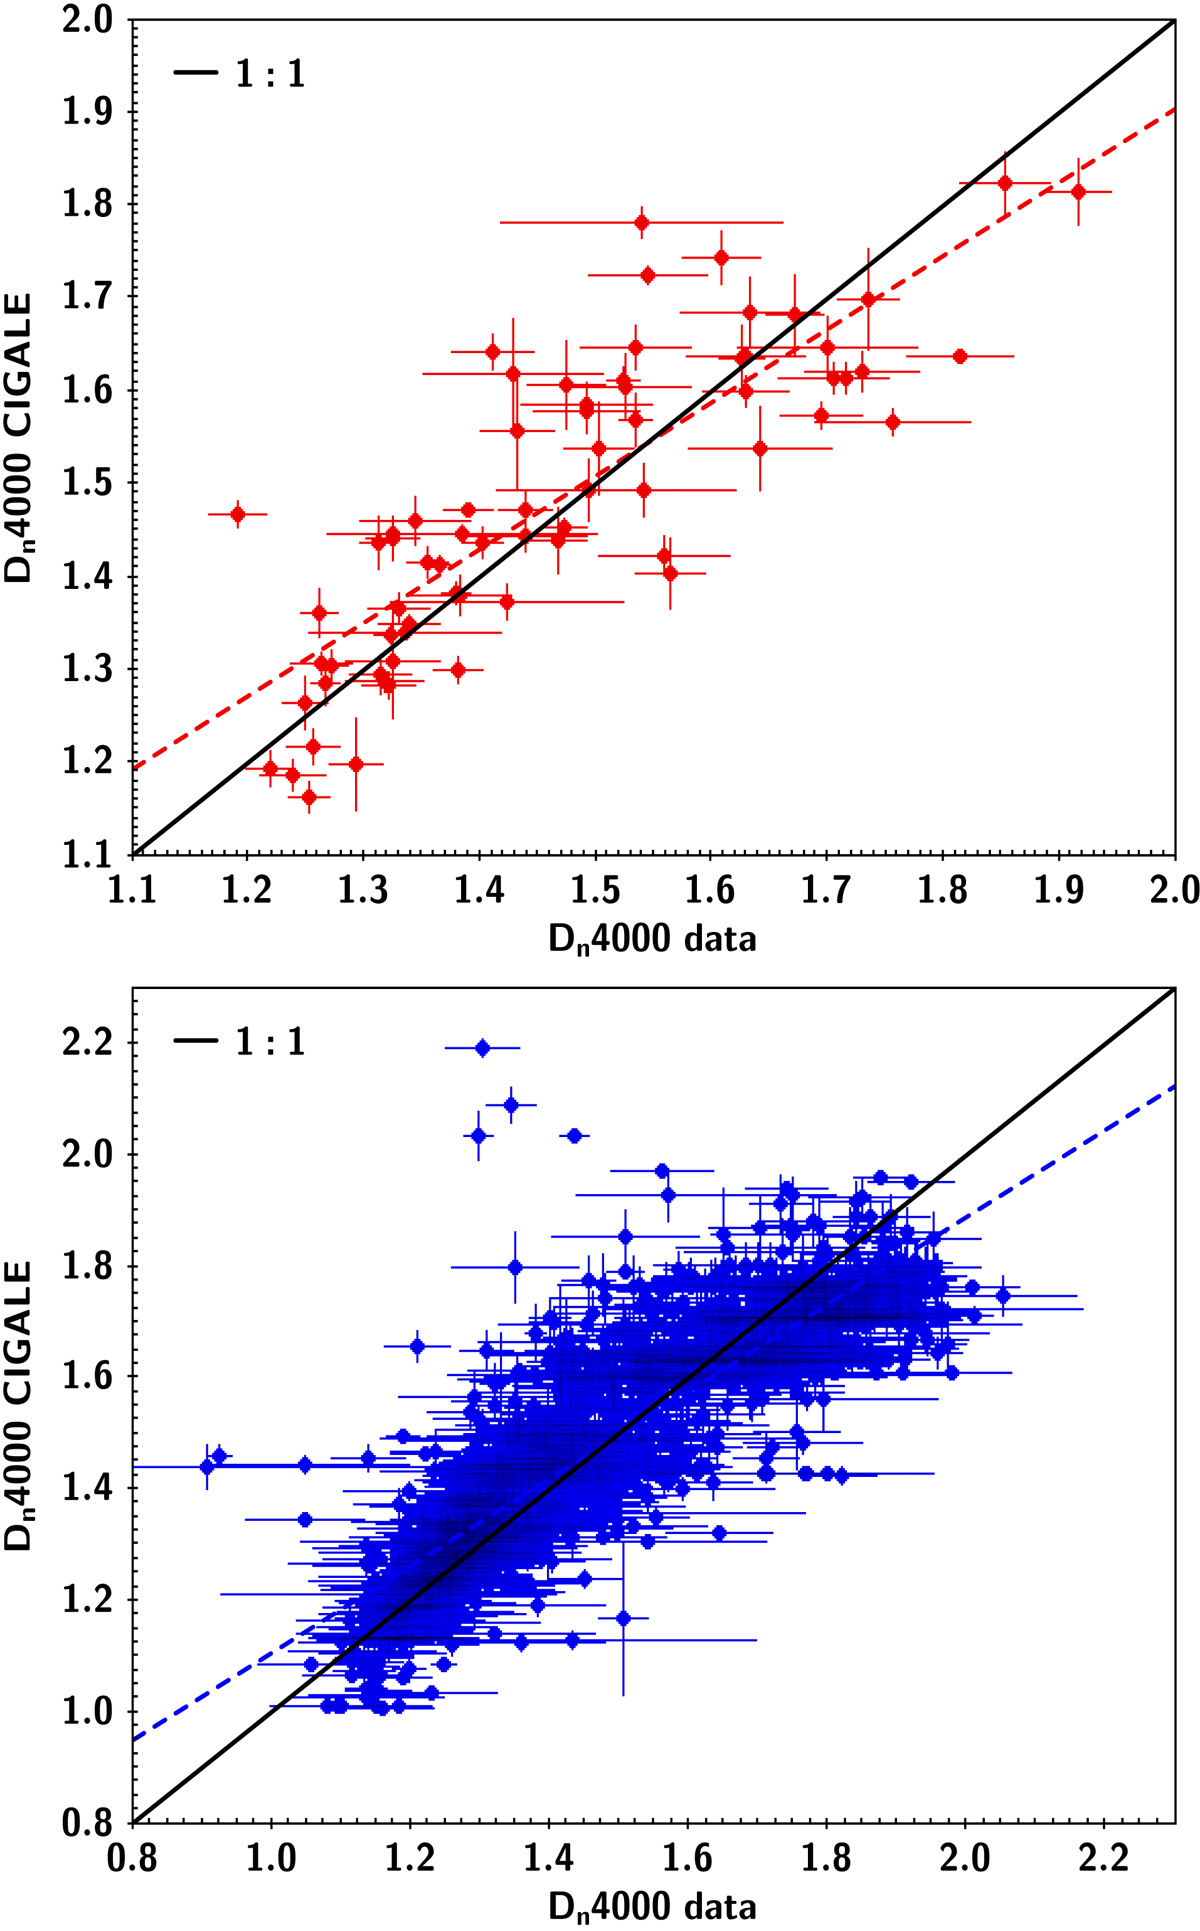
Comparison of Dn4000 measurements of CIGALE with the input (data) values for the AGNs (top panel) and the galaxies in the reference catalogue (bottom panel). The index is not included as input (data) in the fitting process. In both cases, the algorithm successfully recovers the input value of the index. The dashed lines in the two panels present the best linear fits. In the case of AGNs, the fit is given by the following expression: Dn4000CIGALE = 0.7903 × Dn4000data + 0.3236. For the reference sample, a similar equation is found: Dn4000CIGALE = 0.7567 × Dn4000data + 0.3230. Solid black lines present the 1:1 relation.
Current usage metrics show cumulative count of Article Views (full-text article views including HTML views, PDF and ePub downloads, according to the available data) and Abstracts Views on Vision4Press platform.
Data correspond to usage on the plateform after 2015. The current usage metrics is available 48-96 hours after online publication and is updated daily on week days.
Initial download of the metrics may take a while.