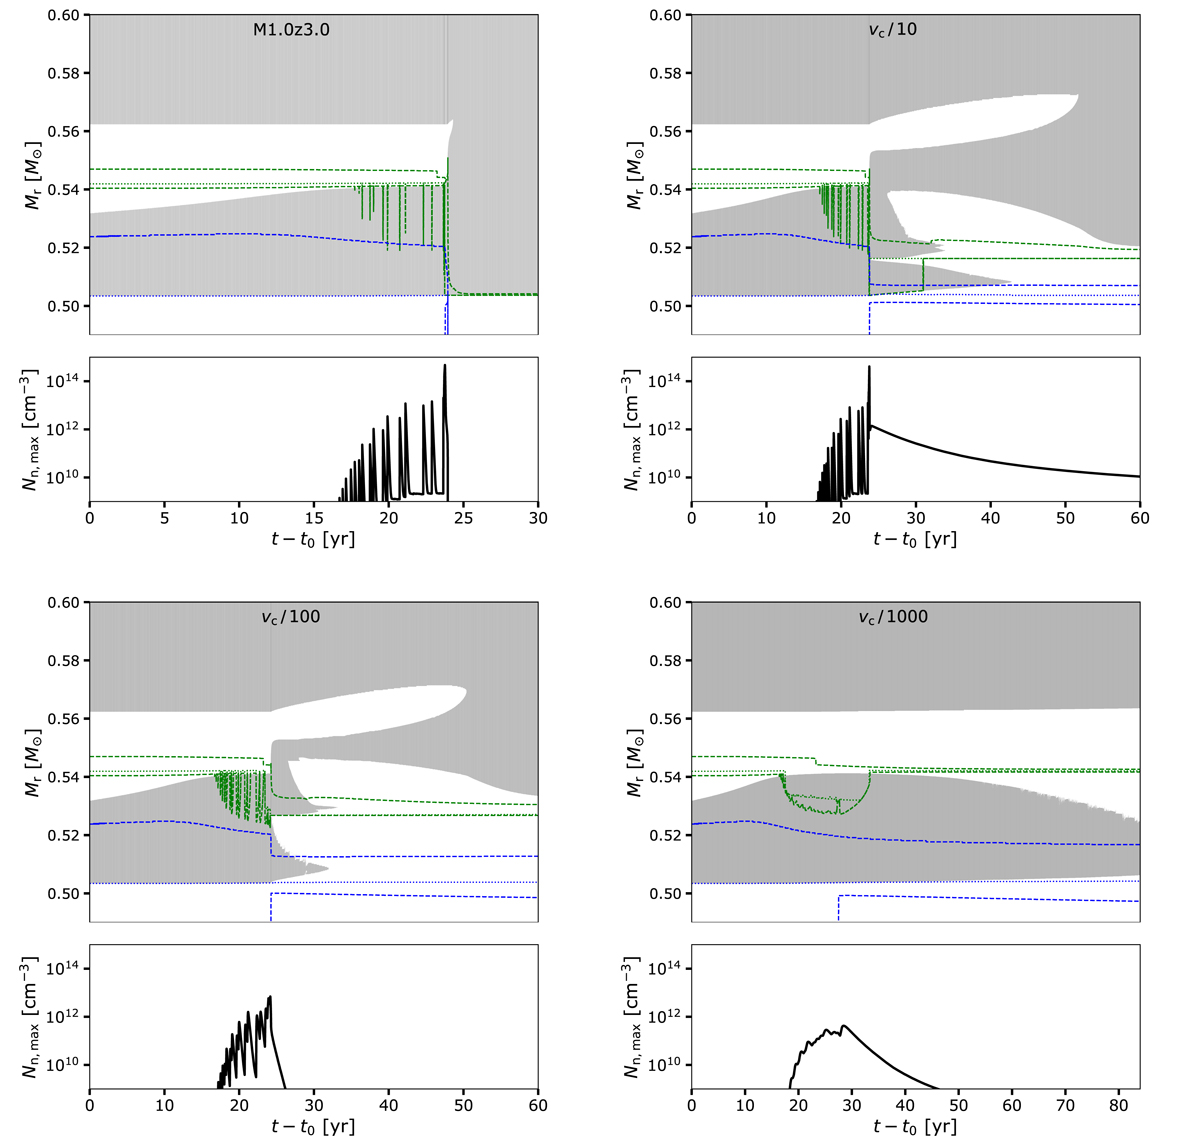
Fig. 6.
Download original image
Kippenhahn diagram and maximal neutron density of the 1 M⊙ model with [Fe/H] = −3.0 during the PIE while considering different values for the convective velocity: the standard case (top left), vconv divided by 10 (top right), 100 (bottom left), and 1000 (bottom right). The dotted green and blue lines in the Kippenhahn diagram correspond to the maximum nuclear energy production by hydrogen- and helium-burning, respectively. The dashed green and blue lines delineate the H- and He-burning zones (when the production of energy by H- and He-burning exceeds 10 erg g−1 s−1).
Current usage metrics show cumulative count of Article Views (full-text article views including HTML views, PDF and ePub downloads, according to the available data) and Abstracts Views on Vision4Press platform.
Data correspond to usage on the plateform after 2015. The current usage metrics is available 48-96 hours after online publication and is updated daily on week days.
Initial download of the metrics may take a while.