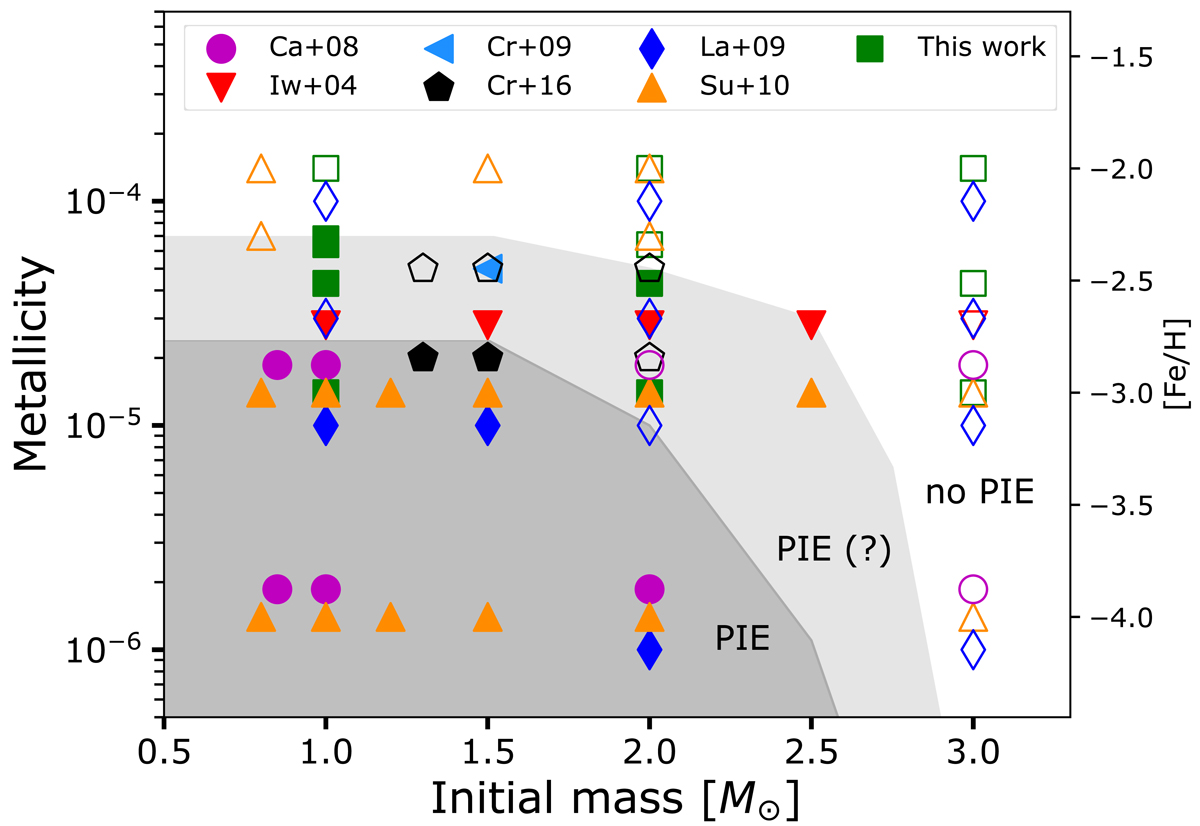
Fig. 3.
Download original image
Mass-metallicity diagram showing the occurrence of PIEs during the early AGB phase of models from various authors. Filled symbols show models experiencing a PIE while empty symbols are for models that do not experience a PIE. The dark grey zone shows the approximate region where PIEs happen in all of the models and the light grey one where PIEs happen in most of the models. The corresponding [Fe/H] ratios are indicated on the right axis assuming solar-scaled mixtures. Models are from Iwamoto et al. (2004, red triangles), Campbell & Lattanzio (2008, magenta circles), Cristallo et al. (2009, blue triangle), Lau et al. (2009, blue diamonds), Suda & Fujimoto (2010, orange triangles), Cristallo et al. (2016, black pentagons). Model results from this work are shown as green squares. All models were computed without extra mixing processes, except the models from Cristallo et al. (2009, 2016), which consider overshooting below the convective envelope.
Current usage metrics show cumulative count of Article Views (full-text article views including HTML views, PDF and ePub downloads, according to the available data) and Abstracts Views on Vision4Press platform.
Data correspond to usage on the plateform after 2015. The current usage metrics is available 48-96 hours after online publication and is updated daily on week days.
Initial download of the metrics may take a while.