Fig. 10.
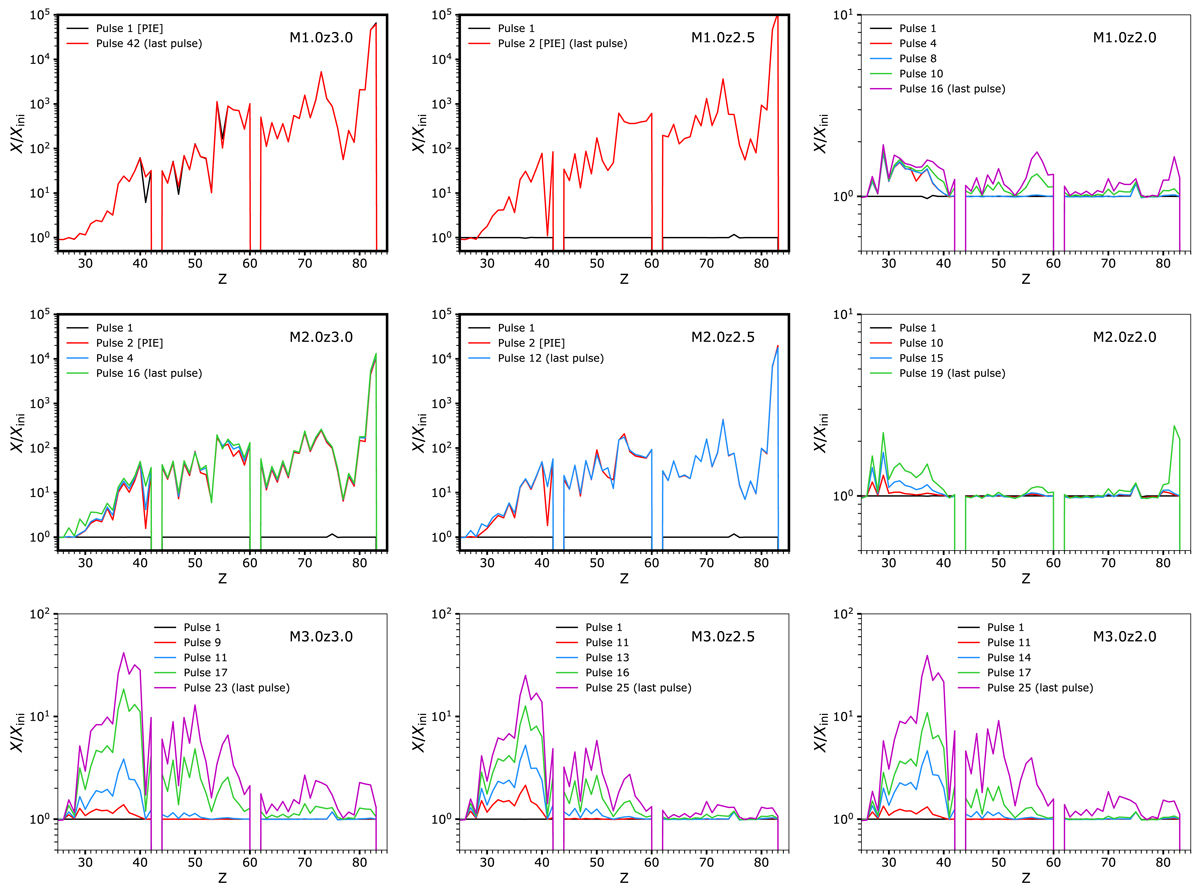
Download original image
Surface elemental mass fractions normalized by their initial mass fractions for the nine models with Mini = 1, 2 and 3 M⊙, and [Fe/H] = −2, −2.5 and −3. The initial mass is increasing from the top to the bottom panels and the initial metallicity is increasing from the left to the right panels. The patterns correspond to the surface abundances after the indicated pulse number. The bold frames highlights models experiencing a PIE. Unstable isotopes are not beta-decayed and the unstable Z = 43 and Z = 61 elements are not considered since Xini = 0 for those elements.
Current usage metrics show cumulative count of Article Views (full-text article views including HTML views, PDF and ePub downloads, according to the available data) and Abstracts Views on Vision4Press platform.
Data correspond to usage on the plateform after 2015. The current usage metrics is available 48-96 hours after online publication and is updated daily on week days.
Initial download of the metrics may take a while.