Fig. 14.

Download original image
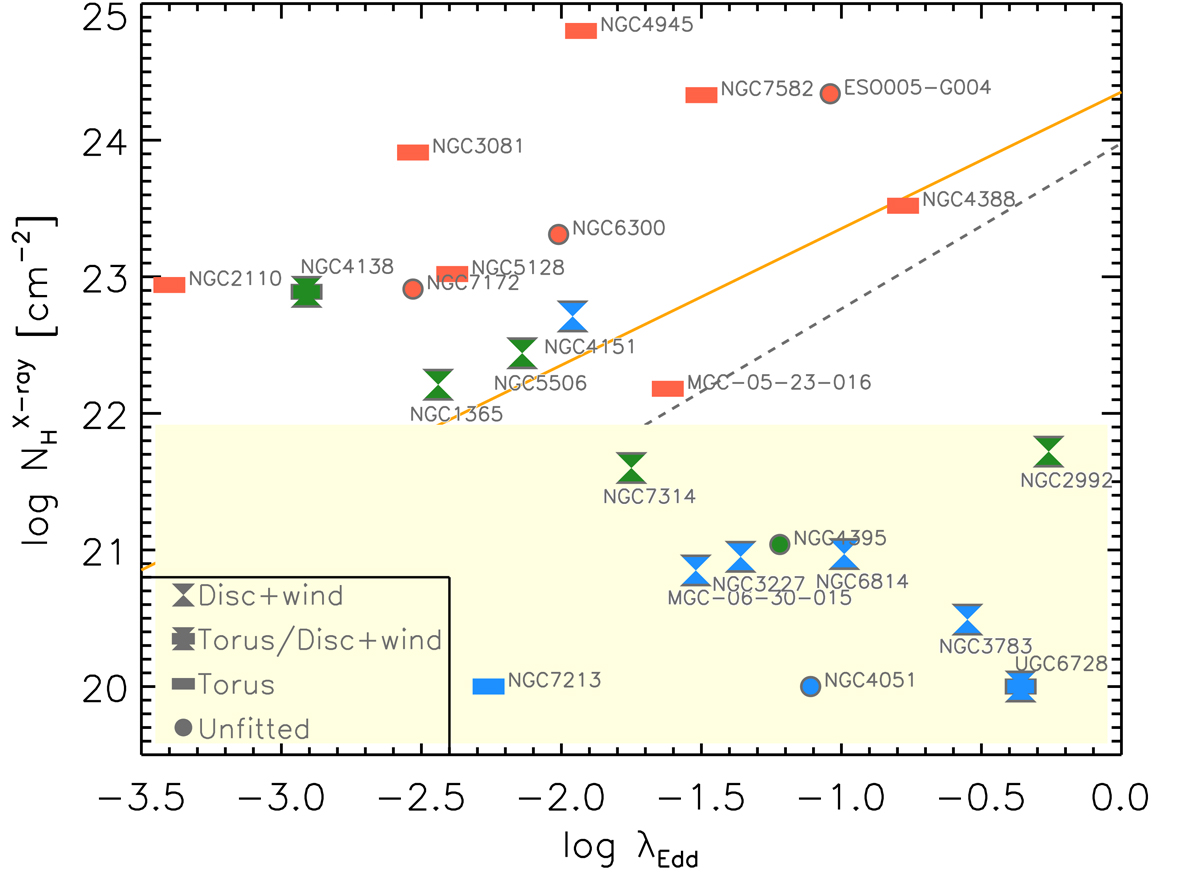
Relation between the X-ray hydrogen column density and the Eddington ratio for the BCS40 sample. Blue, green, and red symbols represent Sy1, Sy1.8/1.9 and Sy2, respectively. The yellow shaded region corresponds to the region where X-ray column density might not be representative of the molecular gas column density of the torus (i.e. ![]() ; García-Burillo et al. 2021). The orange solid line is the limit for IR dusty outflows derived by Venanzi et al. (2020) (assuming LAGN = 2.2 × 1043 erg s−1), and the black dashed line represents the blowout limit predicted by Fabian et al. (2008). Filled bar and hourglass symbols denote galaxies best fitted by torus and disc+wind models, respectively. Filled circles represent those galaxies not fitted by any of the models used in this work.
; García-Burillo et al. 2021). The orange solid line is the limit for IR dusty outflows derived by Venanzi et al. (2020) (assuming LAGN = 2.2 × 1043 erg s−1), and the black dashed line represents the blowout limit predicted by Fabian et al. (2008). Filled bar and hourglass symbols denote galaxies best fitted by torus and disc+wind models, respectively. Filled circles represent those galaxies not fitted by any of the models used in this work.
Current usage metrics show cumulative count of Article Views (full-text article views including HTML views, PDF and ePub downloads, according to the available data) and Abstracts Views on Vision4Press platform.
Data correspond to usage on the plateform after 2015. The current usage metrics is available 48-96 hours after online publication and is updated daily on week days.
Initial download of the metrics may take a while.


