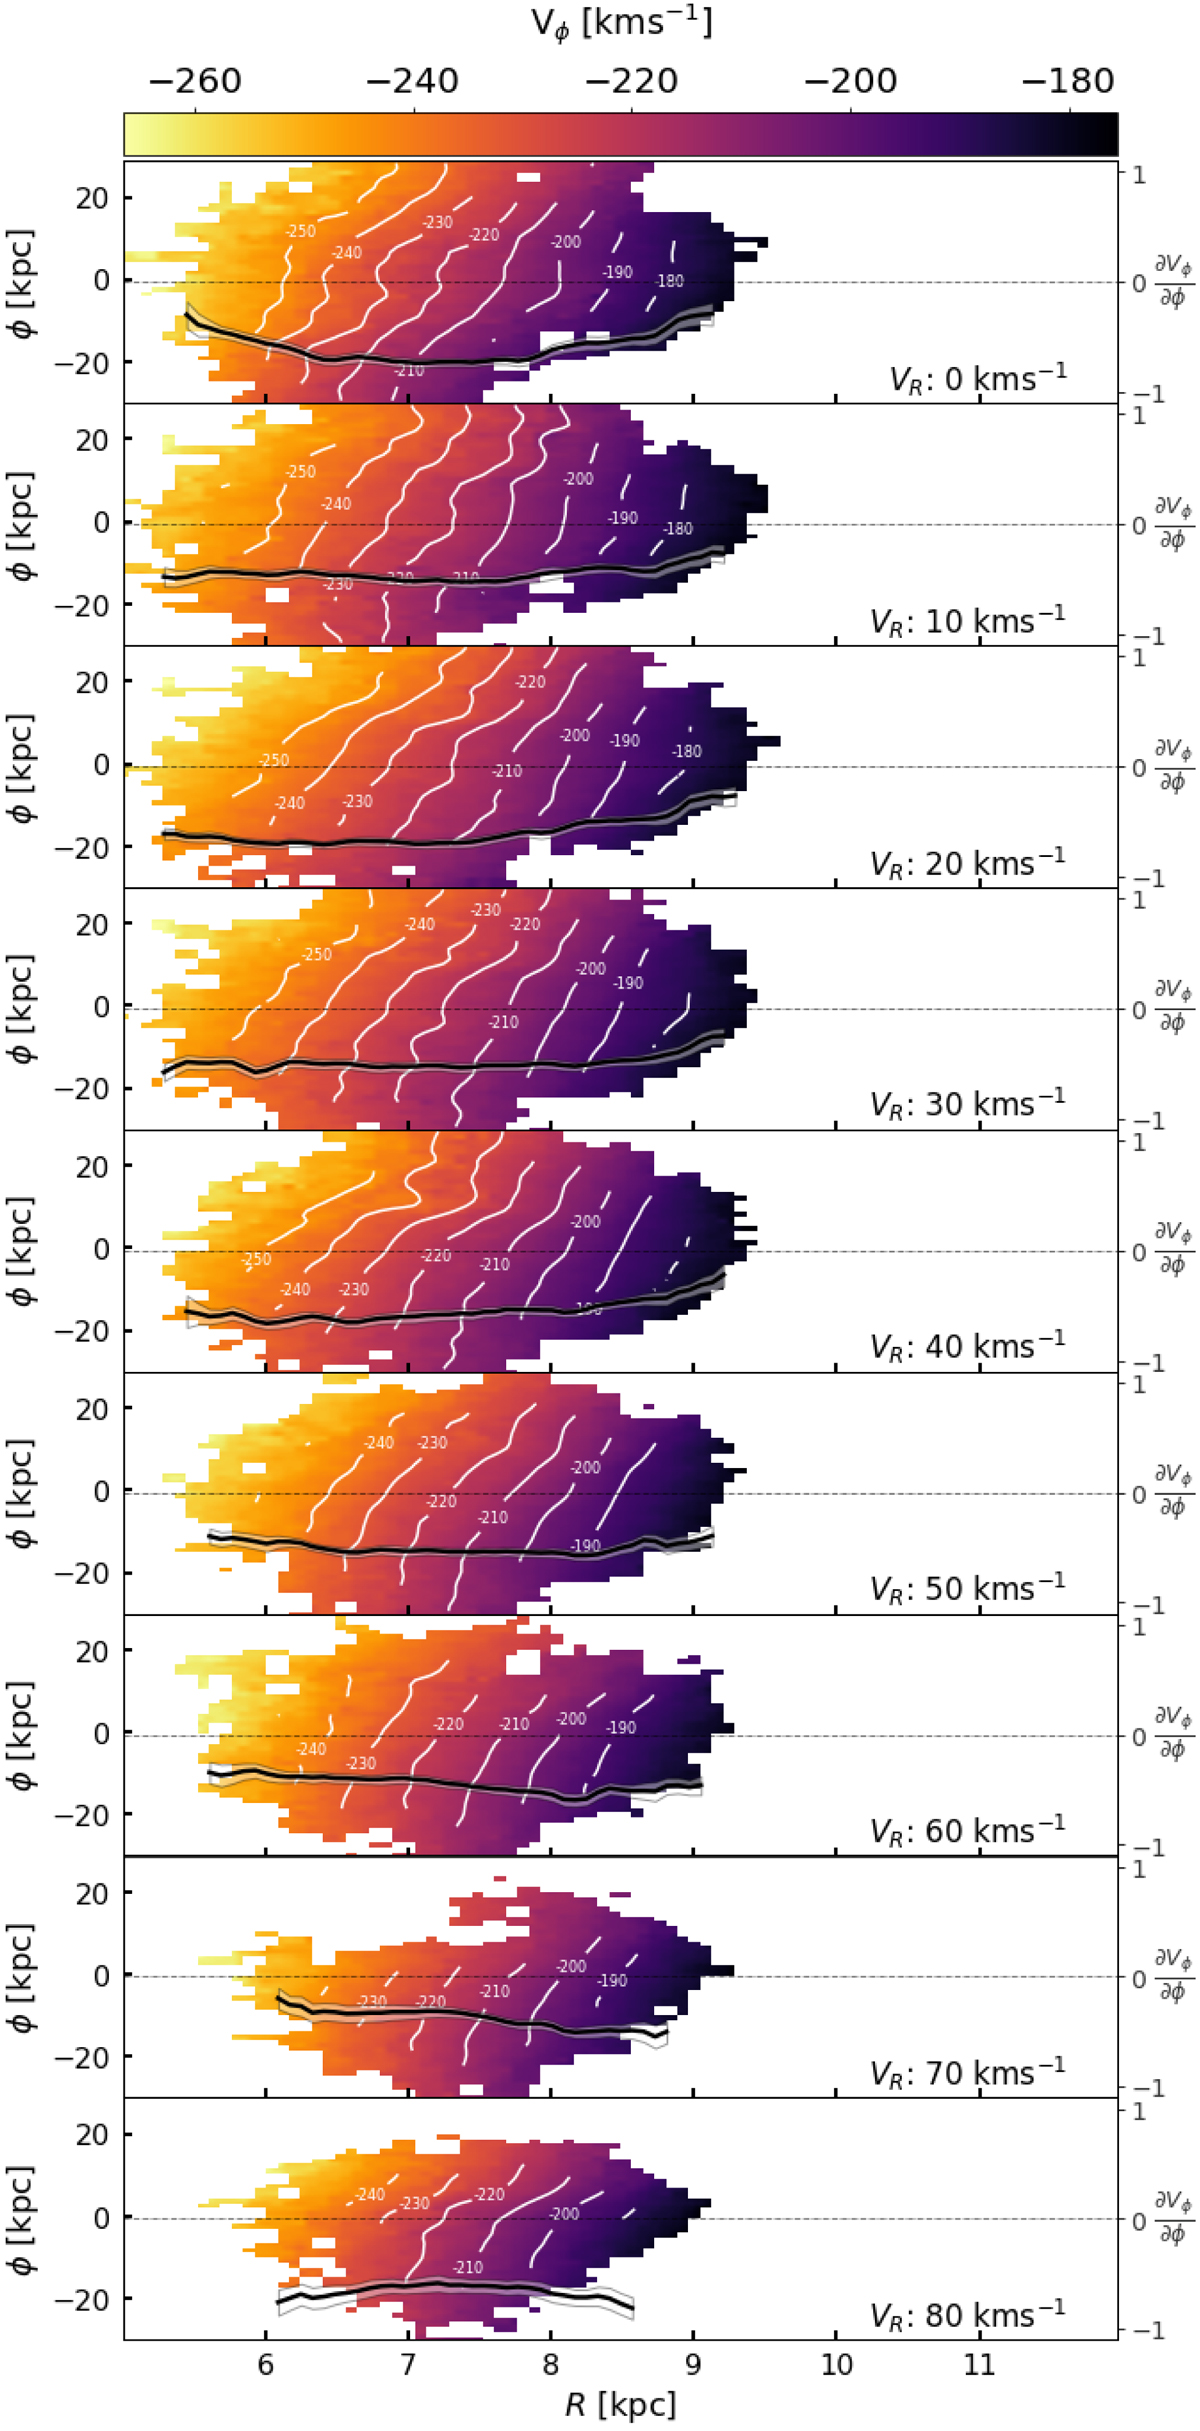
Fig. C.1.
Download original image
Mean azimuthal velocity of the groups in Hercules in the R − ϕ projection, for |Z|< 0.2 kpc. The contours of regions with the same velocity are shown for clarity (in white). The slope of the linear fitting (ϕ, Vϕ) is shown (in black) for every R column, in units of [km s−1 deg−1]. The 3σ error of the slope is shown in a translucent region around the line. The group has the same slope at all VR. This corresponds to a vertical displacement of the moving group in the VR-Vϕ diagram.
Current usage metrics show cumulative count of Article Views (full-text article views including HTML views, PDF and ePub downloads, according to the available data) and Abstracts Views on Vision4Press platform.
Data correspond to usage on the plateform after 2015. The current usage metrics is available 48-96 hours after online publication and is updated daily on week days.
Initial download of the metrics may take a while.